## Diagram: Information Flow from Nature Variables to Label Classification
### Overview
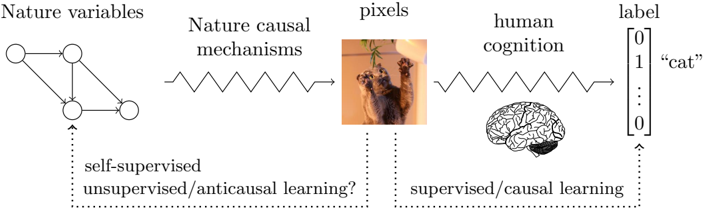
The diagram illustrates a conceptual pipeline for processing natural phenomena into labeled outputs, integrating elements of machine learning, human cognition, and biological systems. It depicts a flow from abstract "nature variables" through causal mechanisms to pixel-based representations, human cognitive processing, and final label assignment.
### Components/Axes
1. **Left Section (Nature Variables → Causal Mechanisms → Pixels)**
- **Nature variables**: Graphical representation with 4 nodes connected by bidirectional edges (suggesting complex interdependencies).
- **Nature causal mechanisms**: Zig-zag waveform symbolizing dynamic, non-linear transformations.
- **Pixels**: Image of two cats interacting with a hanging object (visual input representation).
- **Question**: "self-supervised/unsupervised/anticausal learning?" (annotated with dotted arrow from nature variables).
2. **Right Section (Human Cognition → Label)**
- **Human cognition**: Stylized brain illustration with highlighted regions (prefrontal cortex, hippocampus).
- **Label**: Binary classification matrix with:
- Top row: `[0, 1, ..., 0]` (one-hot encoding)
- Bottom row: `"cat"` (text label)
- **Question**: "supervised/causal learning?" (annotated with dotted arrow from human cognition).
3. **Connecting Elements**
- Arrows show directional flow:
- Nature variables → Causal mechanisms → Pixels
- Pixels → Human cognition → Label
- Dotted arrows indicate alternative pathways/uncertainties.
### Detailed Analysis
- **Nature Variables**: The graph structure implies a system of interrelated environmental factors (e.g., temperature, humidity, light cycles) influencing biological systems.
- **Causal Mechanisms**: The waveform suggests temporal dynamics (e.g., neural spiking patterns, ecological feedback loops) transforming raw variables into sensory inputs.
- **Pixel Representation**: The cat image serves as a concrete example of how abstract variables manifest as visual data (e.g., camera sensor output).
- **Human Cognition**: The brain illustration emphasizes biological pattern recognition, with emphasis on cortical areas involved in visual processing and memory.
- **Label System**: The binary matrix indicates a classification task where "cat" is the positive class (1) among multiple possible categories.
### Key Observations
1. **Ambiguity in Learning Paradigms**: The question marks highlight unresolved debates about whether self-supervised/anticausal learning (left) or supervised/causal learning (right) better models biological/artificial systems.
2. **Multimodal Integration**: The diagram bridges abstract mathematics (graph theory), physics (waveforms), computer vision (pixels), and neuroscience (brain regions).
3. **Label Certainty**: The one-hot encoding suggests probabilistic classification, while the text label confirms categorical certainty.
### Interpretation
This diagram appears to model the interplay between:
1. **Natural Systems**: How environmental variables (nature variables) interact through causal mechanisms to produce observable phenomena (pixels).
2. **Cognitive Processing**: How biological/artificial systems interpret sensory data (pixels) through learned patterns (human cognition).
3. **Labeling Mechanisms**: The transition from sensory input to categorical understanding, questioning whether this requires explicit supervision (causal learning) or can emerge from self-organization (anticausal learning).
The inclusion of both mathematical graphs and biological illustrations suggests an attempt to unify formal computational models with biological plausibility. The "anticausal learning" question mark particularly implies exploration of whether systems can learn meaningful representations without direct causal supervision, challenging traditional machine learning paradigms.