## Scatter Plot: Anatomy
### Overview
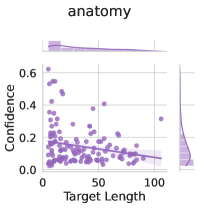
The image is a scatter plot titled "anatomy" showing the relationship between "Target Length" on the x-axis and "Confidence" on the y-axis. The plot includes marginal distributions (histograms with density curves) along both axes. The scatter plot displays individual data points as well as a regression line with a shaded confidence interval.
### Components/Axes
* **Title:** anatomy
* **X-axis:** Target Length
* Scale ranges from 0 to 100, with tick marks at approximately 0, 50, and 100.
* **Y-axis:** Confidence
* Scale ranges from 0.0 to 0.6, with tick marks at approximately 0.0, 0.2, 0.4, and 0.6.
* **Marginal Distributions:**
* Top: Histogram and density curve for Target Length.
* Right: Histogram and density curve for Confidence.
* **Data Points:** Each data point is represented by a purple circle.
* **Regression Line:** A purple line shows the linear regression fit to the data.
* **Confidence Interval:** A shaded purple region around the regression line indicates the confidence interval.
### Detailed Analysis
* **Target Length:**
* The target length values are distributed from approximately 0 to 100.
* The marginal distribution shows a higher frequency of shorter target lengths.
* **Confidence:**
* The confidence values range from approximately 0.0 to 0.6.
* The marginal distribution shows a higher frequency of lower confidence values.
* **Scatter Plot:**
* The scatter plot shows a negative correlation between Target Length and Confidence. As Target Length increases, Confidence tends to decrease.
* There is a cluster of points with low Target Length and varying Confidence values.
* There are fewer points with high Target Length and high Confidence values.
* **Regression Line:**
* The regression line slopes downward, indicating a negative relationship between Target Length and Confidence.
* The confidence interval widens as Target Length increases, suggesting greater uncertainty in the prediction for longer target lengths.
### Key Observations
* Negative correlation between Target Length and Confidence.
* Higher frequency of shorter target lengths and lower confidence values.
* Increased uncertainty in confidence prediction for longer target lengths.
### Interpretation
The data suggests that as the target length increases, the confidence in the prediction tends to decrease. This could be due to various factors, such as the complexity of longer targets or the limitations of the model in handling longer sequences. The widening confidence interval for longer target lengths indicates that the model's predictions become less reliable as the target length increases. The clustering of points with low target length and varying confidence suggests that other factors may influence confidence when the target length is short. Overall, the plot highlights the relationship between target length and confidence and provides insights into the model's performance across different target lengths.