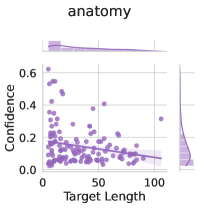
## Scatter Plot with Marginal Distributions: Anatomy
### Overview
The image is a scatter plot chart titled "anatomy." It displays the relationship between "Target Length" on the horizontal axis and "Confidence" on the vertical axis. The chart includes marginal distribution plots (histograms or density curves) along the top and right edges, summarizing the distribution of each variable independently. The primary data is represented by purple circular points.
### Components/Axes
* **Title:** "anatomy" (centered at the top).
* **X-Axis:**
* **Label:** "Target Length"
* **Scale:** Linear scale from 0 to approximately 120.
* **Major Tick Marks:** 0, 50, 100.
* **Y-Axis:**
* **Label:** "Confidence"
* **Scale:** Linear scale from 0.0 to approximately 0.7.
* **Major Tick Marks:** 0.0, 0.2, 0.4, 0.6.
* **Data Series:** A single series of data points, all colored a uniform shade of purple (approximately hex #9467bd).
* **Marginal Plots:**
* **Top Marginal (above main plot):** A distribution plot for the "Target Length" variable. It shows a high, sharp peak near 0, indicating a strong concentration of data points with very short target lengths, and a long, low tail extending to the right.
* **Right Marginal (to the right of main plot):** A distribution plot for the "Confidence" variable. It shows a broad, multi-modal distribution with the highest density between 0.0 and 0.4, tapering off above 0.6.
* **Legend:** No explicit legend is present within the chart area. The single data series is implied by the uniform color of all points.
### Detailed Analysis
* **Data Point Distribution & Trend:**
* **Spatial Grounding:** The data points are densely clustered in the bottom-left quadrant of the plot, specifically where Target Length is between 0 and 40 and Confidence is between 0.0 and 0.4.
* **Trend Verification:** There is a clear, strong negative correlation. As the "Target Length" increases, the "Confidence" value generally decreases. The cloud of points slopes downward from the top-left to the bottom-right.
* **Point Density:** The highest density of points occurs at very short Target Lengths (< 20), where Confidence values span a wide range from near 0.0 up to ~0.65.
* **Sparse Region:** For Target Lengths greater than 50, data points become very sparse. The few points in this region (e.g., near Target Length 70, 90, 110) all have low Confidence values, generally below 0.2.
* **Outliers:** A few points with relatively high Confidence (>0.5) exist, but they are all associated with short Target Lengths (< 30). There are no high-confidence points for long target lengths.
### Key Observations
1. **Concentration at Origin:** The vast majority of the data is concentrated where Target Length is short and Confidence is low-to-moderate.
2. **Inverse Relationship:** The fundamental pattern is that longer targets are associated with lower confidence scores.
3. **Confidence Ceiling:** The maximum observed Confidence decreases as Target Length increases. The highest confidence values (~0.65) only appear for Target Lengths under ~10.
4. **Marginal Confirmation:** The top marginal plot confirms the extreme skew in Target Length (most values are very small). The right marginal plot confirms that Confidence scores are most commonly in the lower half of the range (0.0-0.4).
### Interpretation
This chart likely visualizes the performance of a model or system (e.g., in natural language processing, bioinformatics, or another field involving sequence analysis) tasked with making predictions or identifications ("anatomy") of varying lengths.
* **What the data suggests:** The system is significantly more confident in its outputs when the target it is analyzing is short. As the target becomes longer, the system's confidence in its own output diminishes markedly. This could indicate that the model struggles with complexity, context integration, or noise accumulation over longer sequences.
* **Relationship between elements:** The scatter plot shows the direct, instance-level relationship, while the marginal plots provide a summary of each variable's overall distribution. The dense cluster at low length/low-moderate confidence suggests the system's "comfort zone" is with short, simple targets. The long tail in the Target Length distribution shows that long targets are rare in this dataset.
* **Notable Anomaly/Trend:** The most critical trend is the **confidence decay with length**. This is not just noise; it's a systematic pattern. The absence of any high-confidence points for long targets is a strong signal of a performance limitation. The investigation should focus on why the model's certainty degrades with sequence length—whether due to architectural constraints, training data bias, or inherent problem difficulty.