TECHNICAL ASSET FINGERPRINT
61e95fa2f3a500d2f5324fbf
Click to view fullscreen
Press ESC or click to close
FOUND IN PAPERS
EXPERT: healer-alpha-free VERSION 1
RUNTIME: free/openrouter/healer-alpha
INTEL_VERIFIED
## Bar Chart Grid: Method Comparison on MMLU Datasets
### Overview
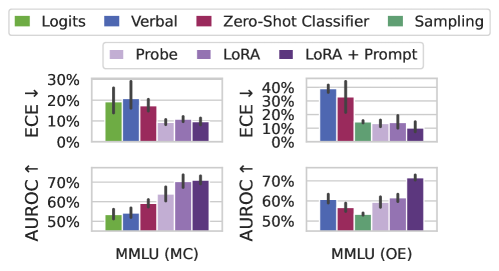
The image displays a 2x2 grid of bar charts comparing the performance of seven different methods on two variants of the MMLU (Massive Multitask Language Understanding) benchmark. The top row charts show Expected Calibration Error (ECE), where lower values are better. The bottom row charts show Area Under the ROC Curve (AUROC), where higher values are better. The left column corresponds to the Multiple Choice (MC) format, and the right column corresponds to the Open-Ended (OE) format.
### Components/Axes
* **Legend:** Positioned at the top of the image, spanning the full width. It defines seven methods with associated colors:
* **Logits:** Green
* **Verbal:** Blue
* **Zero-Shot Classifier:** Red/Maroon
* **Sampling:** Dark Green
* **Probe:** Light Purple/Lavender
* **LoRA:** Medium Purple
* **LoRA + Prompt:** Dark Purple
* **Chart Grid:** A 2x2 arrangement.
* **Top-Left Chart:** Y-axis: "ECE ↓" (0% to 30%). X-axis Group Label: "MMLU (MC)".
* **Top-Right Chart:** Y-axis: "ECE ↓" (0% to 40%). X-axis Group Label: "MMLU (OE)".
* **Bottom-Left Chart:** Y-axis: "AUROC ↑" (50% to 70%). X-axis Group Label: "MMLU (MC)".
* **Bottom-Right Chart:** Y-axis: "AUROC ↑" (50% to 70%). X-axis Group Label: "MMLU (OE)".
* **Data Representation:** Each chart contains two clusters of seven bars each. The left cluster in each chart corresponds to the first four methods (Logits, Verbal, Zero-Shot Classifier, Sampling). The right cluster corresponds to the last three methods (Probe, LoRA, LoRA + Prompt). Each bar has a black error bar extending from its top.
### Detailed Analysis
**Trend Verification & Data Extraction (Approximate Values):**
**1. Top-Left Chart: ECE for MMLU (MC)**
* **Trend:** The first cluster (Logits to Sampling) shows generally higher and more variable ECE. The second cluster (Probe to LoRA+Prompt) shows consistently lower ECE.
* **Data Points (Left Cluster):**
* Logits (Green): ~20%
* Verbal (Blue): ~28% (Highest in this chart)
* Zero-Shot Classifier (Red): ~18%
* Sampling (Dark Green): ~10%
* **Data Points (Right Cluster):**
* Probe (Light Purple): ~10%
* LoRA (Medium Purple): ~12%
* LoRA + Prompt (Dark Purple): ~10%
**2. Top-Right Chart: ECE for MMLU (OE)**
* **Trend:** Similar to the MC chart, the first cluster has higher ECE, with Verbal and Zero-Shot Classifier being notably high. The second cluster is lower and more uniform.
* **Data Points (Left Cluster):**
* Logits (Green): ~38% (Highest in the entire figure)
* Verbal (Blue): ~35%
* Zero-Shot Classifier (Red): ~38%
* Sampling (Dark Green): ~15%
* **Data Points (Right Cluster):**
* Probe (Light Purple): ~15%
* LoRA (Medium Purple): ~15%
* LoRA + Prompt (Dark Purple): ~12%
**3. Bottom-Left Chart: AUROC for MMLU (MC)**
* **Trend:** A clear upward trend is visible from left to right across the methods. The first cluster has lower AUROC, while the second cluster, especially LoRA-based methods, shows significantly higher performance.
* **Data Points (Left Cluster):**
* Logits (Green): ~55%
* Verbal (Blue): ~58%
* Zero-Shot Classifier (Red): ~60%
* Sampling (Dark Green): ~62%
* **Data Points (Right Cluster):**
* Probe (Light Purple): ~68%
* LoRA (Medium Purple): ~70%
* LoRA + Prompt (Dark Purple): ~72% (Highest in this chart)
**4. Bottom-Right Chart: AUROC for MMLU (OE)**
* **Trend:** Performance is more mixed in the first cluster. The second cluster again shows strong performance, with LoRA + Prompt being the clear standout.
* **Data Points (Left Cluster):**
* Logits (Green): ~62%
* Verbal (Blue): ~58%
* Zero-Shot Classifier (Red): ~55%
* Sampling (Dark Green): ~52% (Lowest in this chart)
* **Data Points (Right Cluster):**
* Probe (Light Purple): ~62%
* LoRA (Medium Purple): ~65%
* LoRA + Prompt (Dark Purple): ~72% (Highest in this chart and tied for highest overall)
### Key Observations
1. **Consistent Superiority of Tuning Methods:** The methods in the right cluster (Probe, LoRA, LoRA + Prompt) consistently outperform the methods in the left cluster (Logits, Verbal, Zero-Shot Classifier, Sampling) on both metrics. They achieve lower calibration error (ECE) and higher discriminative performance (AUROC).
2. **LoRA + Prompt is Top Performer:** The "LoRA + Prompt" method (dark purple bar) is the top performer or tied for top in three out of four charts (MC ECE, MC AUROC, OE AUROC).
3. **High Calibration Error for Verbal/Zero-Shot on OE:** The "Verbal" and "Zero-Shot Classifier" methods show particularly high Expected Calibration Error (approaching 40%) on the Open-Ended (OE) task, suggesting they are poorly calibrated in that setting.
4. **Sampling is a Middle Ground:** The "Sampling" method (dark green) often performs better than the first three methods (Logits, Verbal, Zero-Shot) but worse than the tuned methods (Probe, LoRA), acting as an intermediate performer.
5. **Task Difficulty:** The ECE values are generally higher for the OE task (right column) than the MC task (left column), suggesting the open-ended format is more challenging for model calibration.
### Interpretation
This figure presents a comparative analysis of inference-time and fine-tuning methods for large language models on the MMLU benchmark. The data strongly suggests that **parameter-efficient fine-tuning methods (LoRA, Probe) yield models that are both more accurate (higher AUROC) and better calibrated (lower ECE) than methods relying on the base model's raw outputs (Logits, Verbal, Zero-Shot Classifier).**
The "LoRA + Prompt" method's consistent top performance indicates a synergistic effect: fine-tuning the model with LoRA and then further guiding it with a task-specific prompt at inference time provides the best results. The high ECE for "Verbal" and "Zero-Shot Classifier" on the OE task is a critical finding, warning that these simple methods can produce confident but incorrect answers in open-ended generation scenarios.
The clear separation between the two clusters of bars visually argues for the value of investing in tuning (even parameter-efficient tuning) over zero-shot or simple prompting strategies when performance and reliability on complex benchmarks like MMLU are priorities. The error bars, while present, do not overlap between the high-performing and low-performing clusters in most cases, reinforcing the statistical significance of the performance gap.
DECODING INTELLIGENCE...