## Spectrogram Analysis: Signal Processing Stages
### Overview
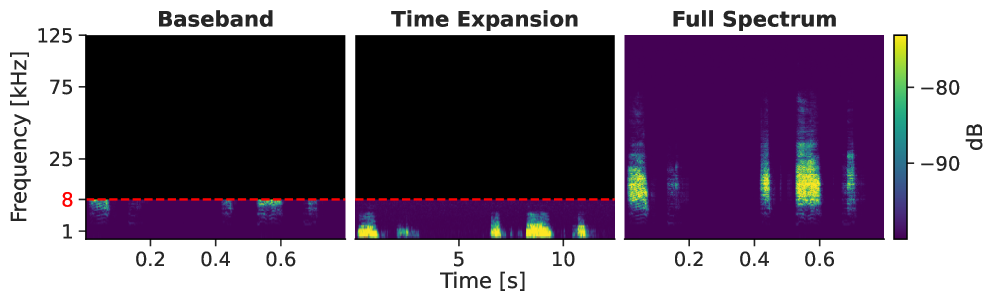
The image presents three sequential stages of signal processing visualization: Baseband, Time Expansion, and Full Spectrum. Each plot uses a spectrogram-like representation with frequency (kHz) on the y-axis and time (s) on the x-axis. Color intensity corresponds to signal strength (dB), with a colorbar indicating values from -90 dB (dark purple) to -80 dB (bright yellow).
### Components/Axes
1. **Baseband Plot**
- **Y-axis**: Frequency [kHz] (1–125 kHz)
- **X-axis**: Time [s] (0.2–0.6 s)
- **Key Feature**: Red dashed line at 8 kHz
- **Color Scale**: Minimal activity (purple/blue) below 8 kHz
2. **Time Expansion Plot**
- **Y-axis**: Frequency [kHz] (1–125 kHz)
- **X-axis**: Time [s] (0–10 s)
- **Key Feature**: Red dashed line at 8 kHz
- **Color Scale**: Increased activity (yellow/green) near 8 kHz
3. **Full Spectrum Plot**
- **Y-axis**: Frequency [kHz] (1–125 kHz)
- **X-axis**: Time [s] (0.2–0.6 s)
- **Color Scale**: Detailed peaks (yellow/green) across 8–125 kHz
- **Legend**: Right-aligned colorbar labeled "dB" (-90 to -80 dB)
### Detailed Analysis
- **Baseband**: Dominated by black (no signal) except for faint purple/blue streaks below 8 kHz. The red dashed line at 8 kHz acts as a reference threshold.
- **Time Expansion**: Expanded time axis reveals intermittent yellow/green pulses near 8 kHz, suggesting transient events or harmonics.
- **Full Spectrum**: Highest detail with vertical yellow/green peaks clustered around 8 kHz and higher frequencies (up to ~125 kHz). Peaks show dB values approaching -80 dB.
### Key Observations
1. **Threshold Significance**: The 8 kHz red line likely represents a critical frequency cutoff or modulation boundary.
2. **Temporal Evolution**: Time Expansion reveals hidden spectral content absent in Baseband, indicating time-domain processing (e.g., modulation/demodulation).
3. **Spectral Detail**: Full Spectrum shows sharp, narrowband peaks (e.g., ~8 kHz, ~20 kHz, ~50 kHz) with dB values up to -80 dB, suggesting structured modulation (e.g., OFDM, FSK).
### Interpretation
The progression from Baseband to Full Spectrum demonstrates:
- **Baseband Limitation**: Original signal is band-limited below 8 kHz, with weak sub-harmonic content.
- **Time Expansion Role**: Temporal stretching uncovers higher-frequency components, possibly through nonlinear processing or sampling rate conversion.
- **Full Spectrum Insight**: Reveals intentional modulation schemes with distinct carrier frequencies and sidebands. The 8 kHz peak may represent a fundamental tone, while higher peaks (20–50 kHz) suggest harmonics or subcarriers.
Notably, the absence of activity above 125 kHz in all plots implies an anti-aliasing filter or sampling rate constraint. The consistent 8 kHz reference across plots suggests it is a design parameter (e.g., sampling frequency divided by 16 for a 128 kHz sample rate).