## Radar Charts: AI Model Performance Comparison
### Overview
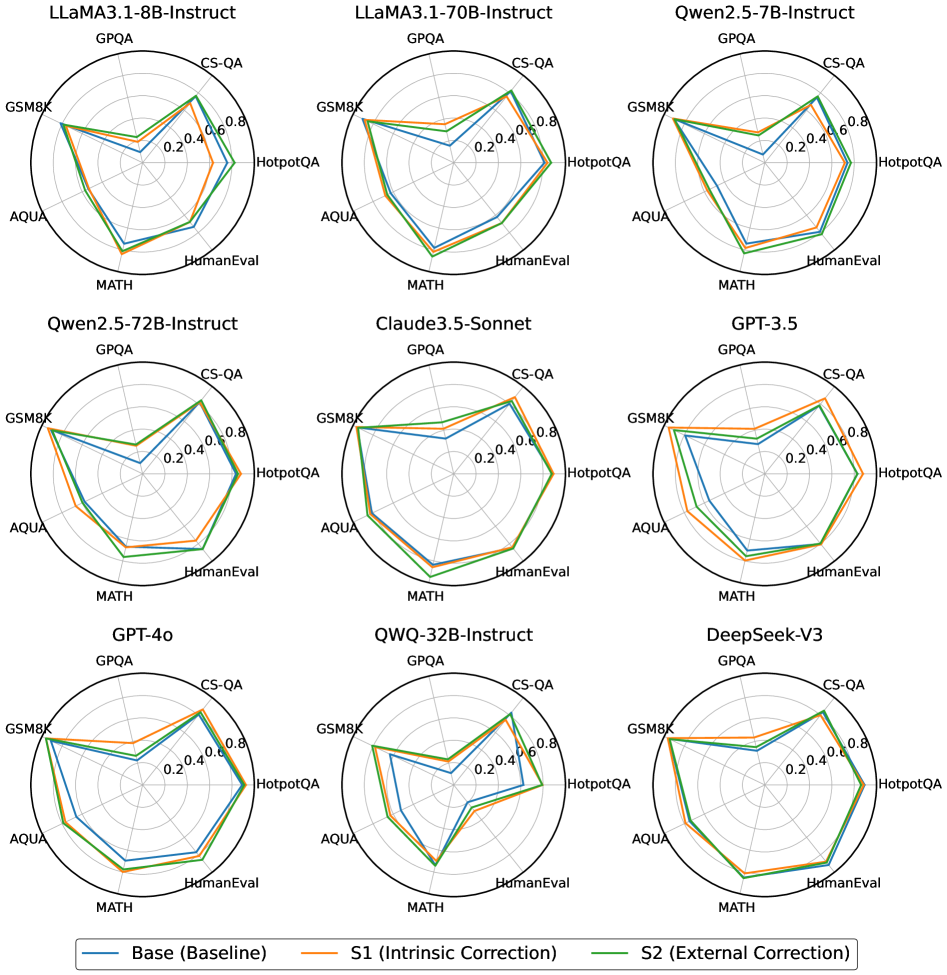
The image contains nine radar charts arranged in a 3x3 grid, comparing the performance of various AI models across seven evaluation metrics. Each chart represents a different model (e.g., LLaMA3.1-8B-Instruct, GPT-4o, DeepSeek-V3), with three performance lines per chart: Base (blue), S1 Intrinsic Correction (orange), and S2 External Correction (green). Axes represent evaluation benchmarks, and values range from 0.0 to 0.8.
### Components/Axes
- **Models**:
- Top row: LLaMA3.1-8B-Instruct, LLaMA3.1-70B-Instruct, Qwen2.5-7B-Instruct
- Middle row: Qwen2.5-72B-Instruct, Claude3.5-Sonnet, GPT-3.5
- Bottom row: GPT-4o, QWQ-32B-Instruct, DeepSeek-V3
- **Axes (clockwise from top-left)**:
- GPQA, CS-QA, GSM8K, HotpotQA, AQUA, MATH, HumanEval
- **Legend**:
- Blue = Base (Baseline)
- Orange = S1 (Intrinsic Correction)
- Green = S2 (External Correction)
### Detailed Analysis
1. **LLaMA3.1-8B-Instruct**:
- Base: Peaks at ~0.6 (GPQA), ~0.5 (CS-QA), ~0.4 (GSM8K)
- S1: Peaks at ~0.7 (GPQA), ~0.6 (CS-QA), ~0.5 (GSM8K)
- S2: Peaks at ~0.5 (GPQA), ~0.4 (CS-QA), ~0.3 (GSM8K)
2. **LLaMA3.1-70B-Instruct**:
- Base: Peaks at ~0.7 (GPQA), ~0.6 (CS-QA), ~0.5 (GSM8K)
- S1: Peaks at ~0.8 (GPQA), ~0.7 (CS-QA), ~0.6 (GSM8K)
- S2: Peaks at ~0.6 (GPQA), ~0.5 (CS-QA), ~0.4 (GSM8K)
3. **Qwen2.5-7B-Instruct**:
- Base: Peaks at ~0.5 (GPQA), ~0.4 (CS-QA), ~0.3 (GSM8K)
- S1: Peaks at ~0.6 (GPQA), ~0.5 (CS-QA), ~0.4 (GSM8K)
- S2: Peaks at ~0.5 (GPQA), ~0.4 (CS-QA), ~0.3 (GSM8K)
4. **Qwen2.5-72B-Instruct**:
- Base: Peaks at ~0.6 (GPQA), ~0.5 (CS-QA), ~0.4 (GSM8K)
- S1: Peaks at ~0.7 (GPQA), ~0.6 (CS-QA), ~0.5 (GSM8K)
- S2: Peaks at ~0.6 (GPQA), ~0.5 (CS-QA), ~0.4 (GSM8K)
5. **Claude3.5-Sonnet**:
- Base: Peaks at ~0.7 (GPQA), ~0.6 (CS-QA), ~0.5 (GSM8K)
- S1: Peaks at ~0.8 (GPQA), ~0.7 (CS-QA), ~0.6 (GSM8K)
- S2: Peaks at ~0.7 (GPQA), ~0.6 (CS-QA), ~0.5 (GSM8K)
6. **GPT-3.5**:
- Base: Peaks at ~0.6 (GPQA), ~0.5 (CS-QA), ~0.4 (GSM8K)
- S1: Peaks at ~0.7 (GPQA), ~0.6 (CS-QA), ~0.5 (GSM8K)
- S2: Peaks at ~0.6 (GPQA), ~0.5 (CS-QA), ~0.4 (GSM8K)
7. **GPT-4o**:
- Base: Peaks at ~0.8 (GPQA), ~0.7 (CS-QA), ~0.6 (GSM8K)
- S1: Peaks at ~0.9 (GPQA), ~0.8 (CS-QA), ~0.7 (GSM8K)
- S2: Peaks at ~0.8 (GPQA), ~0.7 (CS-QA), ~0.6 (GSM8K)
8. **QWQ-32B-Instruct**:
- Base: Peaks at ~0.5 (GPQA), ~0.4 (CS-QA), ~0.3 (GSM8K)
- S1: Peaks at ~0.6 (GPQA), ~0.5 (CS-QA), ~0.4 (GSM8K)
- S2: Peaks at ~0.5 (GPQA), ~0.4 (CS-QA), ~0.3 (GSM8K)
9. **DeepSeek-V3**:
- Base: Peaks at ~0.7 (GPQA), ~0.6 (CS-QA), ~0.5 (GSM8K)
- S1: Peaks at ~0.8 (GPQA), ~0.7 (CS-QA), ~0.6 (GSM8K)
- S2: Peaks at ~0.7 (GPQA), ~0.6 (CS-QA), ~0.5 (GSM8K)
### Key Observations
- **Performance Trends**:
- S1 (Intrinsic Correction) consistently outperforms Base across all models.
- S2 (External Correction) shows mixed results, sometimes matching or slightly underperforming Base.
- GPT-4o and LLaMA3.1-70B-Instruct demonstrate the highest baseline performance.
- **Outliers**:
- QWQ-32B-Instruct shows the lowest performance across all metrics.
- DeepSeek-V3 and Claude3.5-Sonnet exhibit strong S1 gains but minimal S2 improvements.
### Interpretation
The data suggests that **intrinsic correction (S1)** significantly enhances model performance across most evaluation metrics, while **external correction (S2)** has variable effectiveness. GPT-4o and LLaMA3.1-70B-Instruct dominate in raw capability, but smaller models like QWQ-32B-Instruct lag behind. The consistent S1 improvements imply that internal model adjustments (e.g., architecture tweaks) are more impactful than external data corrections. Notably, HumanEval scores (bottom-right axis) remain relatively low for all models, indicating persistent challenges in code generation tasks.