## Line Chart: Information Gain vs. R² Value During Training
### Overview
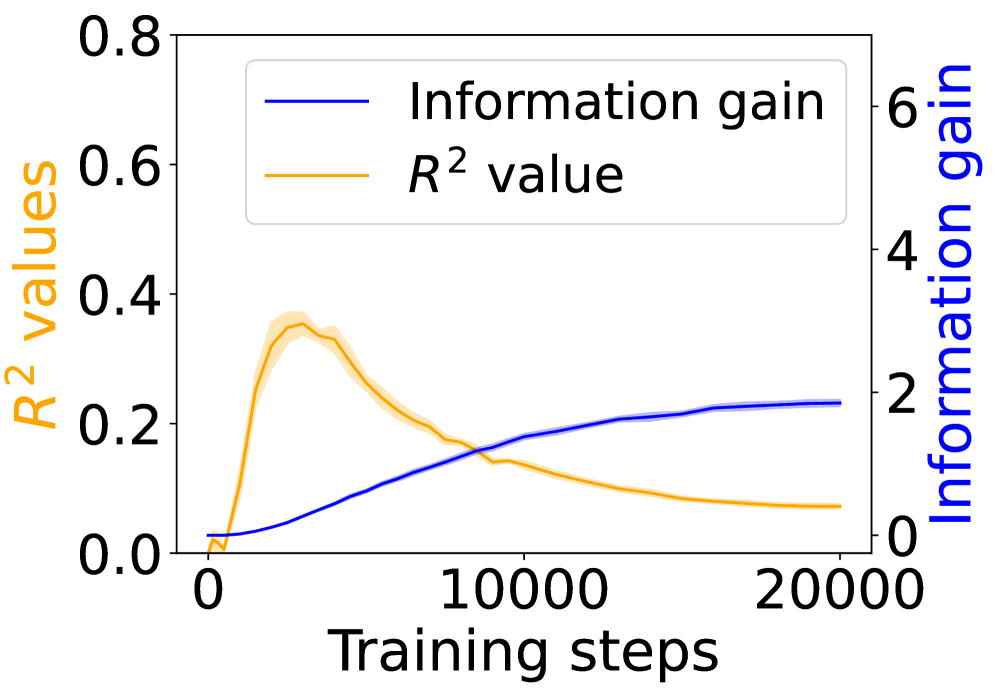
The image is a line chart comparing the "Information gain" and "R² value" over "Training steps." The x-axis represents the number of training steps, ranging from 0 to 20000. The left y-axis represents "R² values," ranging from 0.0 to 0.8. The right y-axis represents "Information gain," ranging from 0 to 6. The chart displays two lines: a blue line representing "Information gain" and an orange line representing "R² value." The R² value line also has a shaded region around it, indicating uncertainty or variance.
### Components/Axes
* **X-axis:** "Training steps" ranging from 0 to 20000. Axis markers are at 0, 10000, and 20000.
* **Left Y-axis:** "R² values" ranging from 0.0 to 0.8. Axis markers are at 0.0, 0.2, 0.4, 0.6, and 0.8.
* **Right Y-axis:** "Information gain" ranging from 0 to 6. Axis markers are at 0, 2, 4, and 6.
* **Legend:** Located at the top-center of the chart.
* Blue line: "Information gain"
* Orange line: "R² value"
### Detailed Analysis
* **Information gain (Blue line):** The "Information gain" starts near 0 at 0 training steps, increases to approximately 1 at 5000 training steps, and continues to increase, reaching approximately 2.2 at 20000 training steps. The trend is generally upward, with a decreasing rate of increase as the training steps increase.
* (0, ~0)
* (5000, ~1)
* (10000, ~1.5)
* (20000, ~2.2)
* **R² value (Orange line):** The "R² value" starts near 0 at 0 training steps, rapidly increases to a peak of approximately 0.35 at around 3000 training steps, and then gradually decreases to approximately 0.08 at 20000 training steps. The trend is initially upward, followed by a downward trend. The shaded region around the orange line indicates the uncertainty in the R² value.
* (0, ~0)
* (3000, ~0.35)
* (10000, ~0.17)
* (20000, ~0.08)
### Key Observations
* The "R² value" peaks early in the training process and then declines, suggesting that the model initially learns quickly but then starts to overfit or lose its ability to generalize.
* The "Information gain" increases steadily throughout the training process, indicating that the model continues to learn and extract useful information from the data.
* The intersection of the two lines occurs at approximately 8000 training steps, where both values are around 0.17 and 1.4 respectively.
### Interpretation
The chart illustrates the trade-off between "Information gain" and "R² value" during the training process. The initial rapid increase in "R² value" suggests that the model quickly adapts to the training data. However, the subsequent decline indicates that the model may be overfitting, losing its ability to generalize to new, unseen data. The continuous increase in "Information gain" suggests that the model continues to extract useful information, even as the "R² value" declines. This could indicate that the model is learning more complex patterns in the data, which may not be reflected in the "R² value." The shaded region around the R² value line suggests that the R² value is not a stable metric.