## Scatter Plot: Model Performance Comparison
### Overview
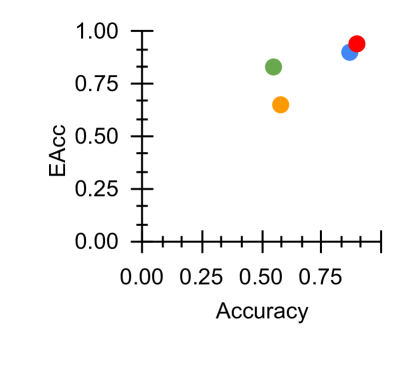
The image displays a scatter plot comparing two performance metrics: "Accuracy" (x-axis) and "EAcc" (y-axis). Four distinct data points are plotted, each represented by a unique color (green, orange, blue, red) and labeled in a legend on the right. The plot suggests a relationship between the two metrics across different models or configurations.
### Components/Axes
- **X-axis (Accuracy)**: Labeled "Accuracy" with a scale from 0.00 to 0.80 in increments of 0.25.
- **Y-axis (EAcc)**: Labeled "EAcc" with a scale from 0.00 to 1.00 in increments of 0.25.
- **Legend**: Positioned on the right side of the plot, associating colors with labels:
- Green: "Model A"
- Orange: "Model B"
- Blue: "Model C"
- Red: "Model D"
### Detailed Analysis
1. **Data Points**:
- **Green (Model A)**: Located at approximately (0.6, 0.8).
- **Orange (Model B)**: Located at approximately (0.4, 0.6).
- **Blue (Model C)**: Located at approximately (0.7, 0.9).
- **Red (Model D)**: Located at approximately (0.8, 1.0).
2. **Trends**:
- All data points exhibit a positive correlation between Accuracy and EAcc, with higher Accuracy generally corresponding to higher EAcc.
- The red point (Model D) achieves the highest values for both metrics, suggesting optimal performance.
- The orange point (Model B) has the lowest values for both metrics, indicating the weakest performance.
### Key Observations
- **Outlier**: The red point (Model D) stands out as the top performer, achieving near-perfect EAcc (1.00) with high Accuracy (0.8).
- **Clustering**: The green and blue points are closely grouped in the upper-right quadrant, indicating similar high performance.
- **Spread**: The orange point is isolated in the lower-left quadrant, highlighting a significant performance gap.
### Interpretation
The plot demonstrates that models with higher Accuracy tend to achieve higher EAcc, though the relationship is not strictly linear. Model D (red) outperforms all others, while Model B (orange) lags significantly. The spread of points suggests variability in model effectiveness, with no single metric dominating the other. This could imply trade-offs between Accuracy and EAcc in model design or that EAcc is a more nuanced metric capturing additional factors beyond raw Accuracy.