## Bar Chart: Used Weights per Layer
### Overview
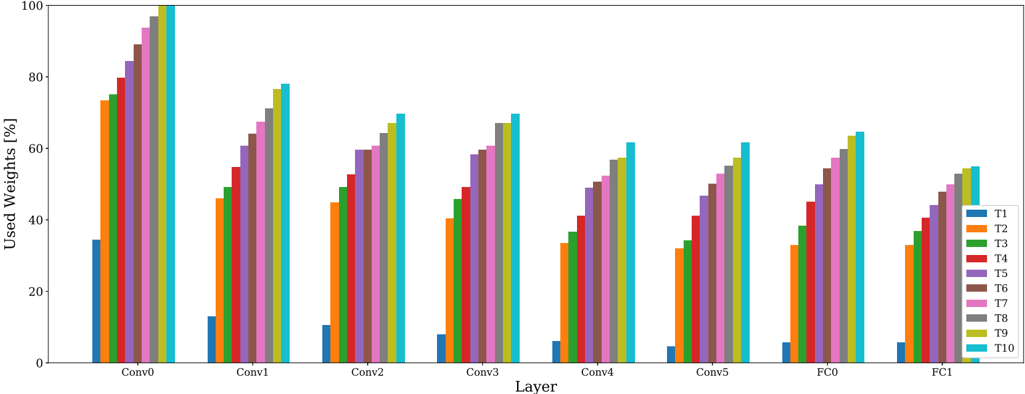
The image is a bar chart showing the percentage of used weights for different layers in a neural network across ten trials (T1 to T10). The x-axis represents the layers (Conv0 to Conv5, FC0, FC1), and the y-axis represents the percentage of used weights, ranging from 0% to 100%. Each layer has a group of bars, with each bar representing a different trial.
### Components/Axes
* **X-axis (Layer):**
* Categories: Conv0, Conv1, Conv2, Conv3, Conv4, Conv5, FC0, FC1
* **Y-axis (Used Weights [%]):**
* Scale: 0 to 100, with tick marks at 0, 20, 40, 60, 80, and 100.
* **Legend (Located at the bottom-right):**
* T1 (Blue)
* T2 (Orange)
* T3 (Green)
* T4 (Red)
* T5 (Purple)
* T6 (Brown)
* T7 (Pink)
* T8 (Gray)
* T9 (Yellow)
* T10 (Teal)
### Detailed Analysis
The chart displays the percentage of used weights for each layer across ten trials (T1-T10). The layers are Conv0, Conv1, Conv2, Conv3, Conv4, Conv5, FC0, and FC1.
* **Conv0:** The percentage of used weights varies significantly across trials. T1 is approximately 30%, while T2-T10 are all above 70%, with T10 reaching nearly 100%.
* **Conv1:** The percentage of used weights is lower than Conv0 for most trials. T1 is very low (around 10%), and T2-T10 range from approximately 40% to 80%.
* **Conv2:** The percentage of used weights increases compared to Conv1. T1 is very low, and T2-T10 range from approximately 50% to 85%.
* **Conv3:** The percentage of used weights is similar to Conv2. T1 is very low, and T2-T10 range from approximately 55% to 85%.
* **Conv4:** The percentage of used weights decreases slightly compared to Conv3. T1 is very low, and T2-T10 range from approximately 45% to 80%.
* **Conv5:** The percentage of used weights decreases further compared to Conv4. T1 is very low, and T2-T10 range from approximately 30% to 70%.
* **FC0:** The percentage of used weights is similar to Conv5. T1 is very low, and T2-T10 range from approximately 40% to 70%.
* **FC1:** The percentage of used weights is the lowest among all layers. T1 is very low, and T2-T10 range from approximately 30% to 60%.
### Key Observations
* Trial T1 (blue) consistently has the lowest percentage of used weights across all layers.
* The percentage of used weights generally decreases from Conv0 to FC1.
* The convolutional layers (Conv0-Conv5) tend to have higher percentages of used weights compared to the fully connected layers (FC0 and FC1).
* There is a significant difference in used weights between T1 and the other trials.
### Interpretation
The chart suggests that the different trials (T1-T10) exhibit varying levels of weight utilization across the layers of the neural network. Trial T1 appears to be an outlier, consistently using a significantly lower percentage of weights compared to the other trials. This could indicate a different training regime, a problem with the data used in T1, or a different set of hyperparameters. The decreasing trend in used weights from convolutional layers to fully connected layers might reflect the architectural design of the network, where convolutional layers are designed to extract features and fully connected layers are used for classification. The lower utilization of weights in FC1 could indicate that the network is becoming more specialized towards the end, or that the final classification task requires fewer parameters.