## Bar Chart: Used Weights per Layer
### Overview
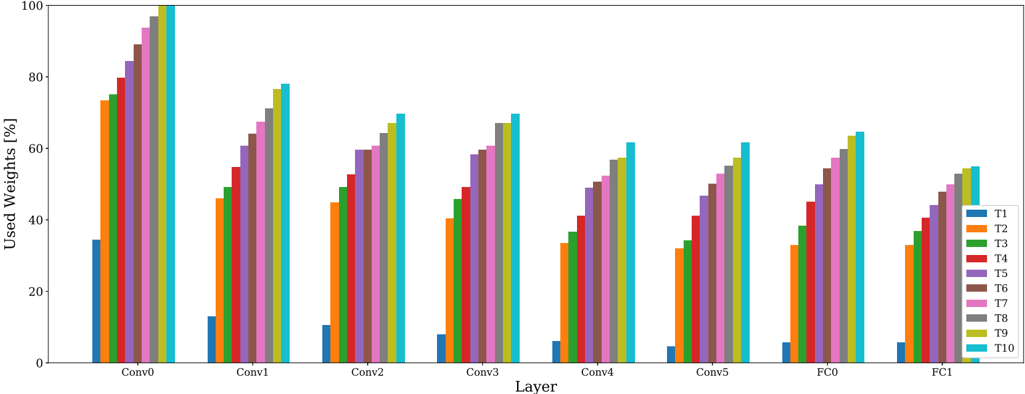
This grouped bar chart illustrates the percentage of "Used Weights" across eight distinct neural network layers (Conv0 through FC1) under ten different experimental conditions or trials (labeled T1 through T10). The chart demonstrates how weight utilization varies across the architecture of the network for each condition.
### Components/Axes
* **Y-Axis**: Labeled "Used Weights [%]", representing the percentage of weights retained or active. The scale ranges from 0 to 100.
* **X-Axis**: Labeled "Layer", categorizing the data into eight groups: Conv0, Conv1, Conv2, Conv3, Conv4, Conv5, FC0, and FC1.
* **Legend**: Located in the bottom-right corner. It maps the ten conditions (T1–T10) to specific colors:
* **T1**: Blue
* **T2**: Orange
* **T3**: Green
* **T4**: Red
* **T5**: Purple
* **T6**: Brown
* **T7**: Pink
* **T8**: Grey
* **T9**: Yellow-Green
* **T10**: Cyan
### Detailed Analysis
The data is organized by layer, with each layer containing ten bars corresponding to T1 through T10. Within every layer, the bars are sorted in ascending order of height (T1 is the shortest, T10 is the tallest).
**Approximate Data Points (by Layer):**
| Layer | T1 | T2 | T3 | T4 | T5 | T6 | T7 | T8 | T9 | T10 |
| :--- | :--- | :--- | :--- | :--- | :--- | :--- | :--- | :--- | :--- | :--- |
| **Conv0** | ~35% | ~74% | ~75% | ~80% | ~85% | ~89% | ~93% | ~97% | ~99% | 100% |
| **Conv1** | ~13% | ~46% | ~49% | ~55% | ~61% | ~64% | ~67% | ~71% | ~76% | ~78% |
| **Conv2** | ~11% | ~45% | ~49% | ~53% | ~60% | ~60% | ~61% | ~64% | ~67% | ~70% |
| **Conv3** | ~8% | ~40% | ~46% | ~49% | ~58% | ~59% | ~60% | ~64% | ~67% | ~70% |
| **Conv4** | ~6% | ~33% | ~36% | ~41% | ~49% | ~50% | ~52% | ~57% | ~58% | ~62% |
| **Conv5** | ~5% | ~32% | ~34% | ~41% | ~47% | ~50% | ~53% | ~55% | ~58% | ~62% |
| **FC0** | ~6% | ~33% | ~38% | ~45% | ~50% | ~54% | ~57% | ~60% | ~64% | ~65% |
| **FC1** | ~6% | ~33% | ~37% | ~40% | ~44% | ~48% | ~50% | ~53% | ~54% | ~55% |
### Key Observations
* **Consistent Ranking**: Across all layers, T1 consistently represents the lowest weight usage, while T10 represents the highest.
* **Layer-wise Decline**: There is a general downward trend in weight usage as the network progresses from Conv0 to FC1. Conv0 has the highest overall weight usage, while FC1 has the lowest.
* **Compression Sensitivity**: The gap between the lowest (T1) and highest (T10) usage is most extreme at Conv0 (a range of ~65 percentage points) and becomes significantly more compressed by the time the network reaches FC1 (a range of ~49 percentage points).
* **Anomalies**: The transition from Conv5 to FC0 shows a slight *increase* in weight usage for most trials (T2–T10), breaking the otherwise monotonic downward trend observed from Conv0 through Conv5.
### Interpretation
This chart likely depicts the results of a **neural network pruning experiment**.
* **"Used Weights"** refers to the percentage of weights remaining after a pruning algorithm has been applied.
* **T1 through T10** likely represent different pruning intensity levels or compression ratios, where T1 is the most aggressive pruning (lowest percentage of weights remaining) and T10 is the least aggressive.
* **Architectural Sensitivity**: The data suggests that the early layers (Conv0) are either more robust to pruning or were intentionally preserved with more weights compared to the deeper layers. The slight uptick in usage at the FC0 layer suggests that the fully connected layers might have a different sensitivity profile or were subjected to a different pruning policy than the convolutional layers.
* **Conclusion**: The model architecture is heavily pruned in the deeper layers (FC1) compared to the input-facing layers (Conv0), which is a common strategy in model compression to reduce computational cost while maintaining accuracy.