\n
## Bar Chart: Used Weights by Layer and Task
### Overview
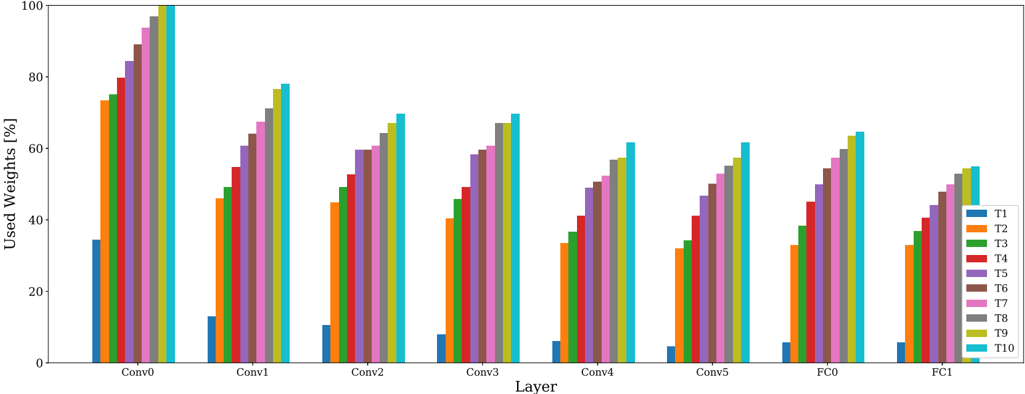
The image presents a bar chart illustrating the percentage of used weights for different layers (Conv0 to FC1) across ten tasks (T1 to T10). The y-axis represents the "Used Weights [%]", ranging from 0 to 100, while the x-axis represents the "Layer". Each layer has ten bars, one for each task.
### Components/Axes
* **X-axis:** "Layer" with markers: Conv0, Conv1, Conv2, Conv3, Conv4, Conv5, FC0, FC1.
* **Y-axis:** "Used Weights [%]" with a scale from 0 to 100.
* **Legend:** Located in the top-right corner, identifying each task with a corresponding color:
* T1 (Red)
* T2 (Orange)
* T3 (Yellow)
* T4 (Green)
* T5 (Cyan)
* T6 (Blue)
* T7 (Purple)
* T8 (Pink)
* T9 (Magenta)
* T10 (Light Blue)
### Detailed Analysis
The chart consists of eight groups of bars, one for each layer. Within each group, there are ten bars representing the used weights for each of the ten tasks.
**Conv0:**
* T1: Approximately 78%
* T2: Approximately 72%
* T3: Approximately 80%
* T4: Approximately 85%
* T5: Approximately 75%
* T6: Approximately 70%
* T7: Approximately 82%
* T8: Approximately 77%
* T9: Approximately 88%
* T10: Approximately 73%
**Conv1:**
* T1: Approximately 75%
* T2: Approximately 68%
* T3: Approximately 78%
* T4: Approximately 82%
* T5: Approximately 72%
* T6: Approximately 65%
* T7: Approximately 79%
* T8: Approximately 74%
* T9: Approximately 85%
* T10: Approximately 69%
**Conv2:**
* T1: Approximately 60%
* T2: Approximately 55%
* T3: Approximately 65%
* T4: Approximately 70%
* T5: Approximately 62%
* T6: Approximately 58%
* T7: Approximately 68%
* T8: Approximately 63%
* T9: Approximately 75%
* T10: Approximately 56%
**Conv3:**
* T1: Approximately 65%
* T2: Approximately 60%
* T3: Approximately 70%
* T4: Approximately 75%
* T5: Approximately 67%
* T6: Approximately 62%
* T7: Approximately 72%
* T8: Approximately 68%
* T9: Approximately 80%
* T10: Approximately 61%
**Conv4:**
* T1: Approximately 50%
* T2: Approximately 45%
* T3: Approximately 55%
* T4: Approximately 60%
* T5: Approximately 52%
* T6: Approximately 48%
* T7: Approximately 58%
* T8: Approximately 53%
* T9: Approximately 65%
* T10: Approximately 46%
**Conv5:**
* T1: Approximately 40%
* T2: Approximately 35%
* T3: Approximately 45%
* T4: Approximately 50%
* T5: Approximately 42%
* T6: Approximately 38%
* T7: Approximately 48%
* T8: Approximately 43%
* T9: Approximately 55%
* T10: Approximately 36%
**FC0:**
* T1: Approximately 65%
* T2: Approximately 60%
* T3: Approximately 70%
* T4: Approximately 75%
* T5: Approximately 67%
* T6: Approximately 62%
* T7: Approximately 72%
* T8: Approximately 68%
* T9: Approximately 80%
* T10: Approximately 61%
**FC1:**
* T1: Approximately 45%
* T2: Approximately 40%
* T3: Approximately 50%
* T4: Approximately 55%
* T5: Approximately 47%
* T6: Approximately 43%
* T7: Approximately 53%
* T8: Approximately 48%
* T9: Approximately 60%
* T10: Approximately 41%
### Key Observations
* The used weights generally decrease as the layer number increases, particularly from Conv0 to Conv5.
* Task T9 consistently exhibits higher used weights across all layers compared to other tasks.
* Tasks T1, T3, and T4 generally have higher used weights than tasks T2, T6, and T10.
* The difference in used weights between tasks is more pronounced in the earlier layers (Conv0-Conv3) than in the later layers (FC0-FC1).
### Interpretation
The chart suggests that the initial convolutional layers (Conv0-Conv3) capture more task-specific information, as evidenced by the higher and more varied used weights. As the data progresses through the network, the weights become more generalized, leading to lower and more similar used weights in the later layers (FC0-FC1). The consistent high usage of weights in Task T9 indicates that this task may require a more complex representation or a larger portion of the network's capacity. The decreasing trend in used weights across layers could be due to feature aggregation and abstraction, where the network learns to represent information more efficiently in higher layers. The differences between tasks highlight the diversity of the learning process and the network's ability to adapt to different challenges. The data suggests that the network is not uniformly utilizing all its weights for all tasks, indicating potential areas for optimization or pruning.