TECHNICAL ASSET FINGERPRINT
62372bd2b081173e67c607e6
Click to view fullscreen
Press ESC or click to close
FOUND IN PAPERS
EXPERT: healer-alpha-free VERSION 1
RUNTIME: free/openrouter/healer-alpha
INTEL_VERIFIED
## Grouped Bar Chart: Used Weights Percentage by Layer and Threshold
### Overview
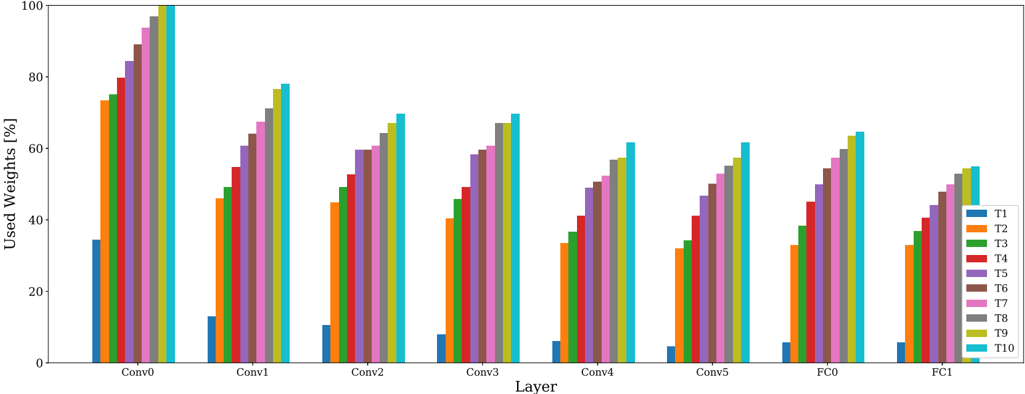
The image displays a grouped bar chart titled (implicitly) "Used Weights [%]" across different neural network layers. The chart compares the percentage of used weights for ten different thresholds or configurations (labeled T1 through T10) across eight distinct layers of a model. The overall visual trend shows that within each layer group, the percentage of used weights increases from T1 to T10. Furthermore, the overall percentage of used weights tends to decrease as we move from the earlier convolutional layers (Conv0) to the later fully connected layers (FC1).
### Components/Axes
* **X-Axis (Horizontal):** Labeled "Layer". It contains eight categorical groups representing different layers of a neural network. From left to right, they are: `Conv0`, `Conv1`, `Conv2`, `Conv3`, `Conv4`, `Conv5`, `FC0`, `FC1`.
* **Y-Axis (Vertical):** Labeled "Used Weights [%]". It is a linear scale ranging from 0 to 100, with major tick marks at intervals of 20 (0, 20, 40, 60, 80, 100).
* **Legend:** Positioned on the right side of the chart. It defines ten data series, each represented by a distinct color:
* T1: Blue
* T2: Orange
* T3: Green
* T4: Red
* T5: Purple
* T6: Brown
* T7: Pink
* T8: Gray
* T9: Olive/Yellow-Green
* T10: Cyan/Light Blue
### Detailed Analysis
The chart presents data for eight layer groups. Each group contains ten bars, one for each T-series (T1-T10). Below is an approximate breakdown of the "Used Weights [%]" for each bar within each layer group. Values are estimated from the y-axis.
**Layer: Conv0**
* Trend: Steep, consistent increase from T1 to T10.
* Approximate Values:
* T1 (Blue): ~35%
* T2 (Orange): ~73%
* T3 (Green): ~75%
* T4 (Red): ~80%
* T5 (Purple): ~84%
* T6 (Brown): ~88%
* T7 (Pink): ~92%
* T8 (Gray): ~96%
* T9 (Olive): ~98%
* T10 (Cyan): ~100%
**Layer: Conv1**
* Trend: Consistent increase from T1 to T10.
* Approximate Values:
* T1 (Blue): ~13%
* T2 (Orange): ~46%
* T3 (Green): ~48%
* T4 (Red): ~55%
* T5 (Purple): ~61%
* T6 (Brown): ~64%
* T7 (Pink): ~68%
* T8 (Gray): ~72%
* T9 (Olive): ~76%
* T10 (Cyan): ~78%
**Layer: Conv2**
* Trend: Consistent increase from T1 to T10.
* Approximate Values:
* T1 (Blue): ~10%
* T2 (Orange): ~45%
* T3 (Green): ~49%
* T4 (Red): ~52%
* T5 (Purple): ~60%
* T6 (Brown): ~60%
* T7 (Pink): ~63%
* T8 (Gray): ~65%
* T9 (Olive): ~67%
* T10 (Cyan): ~70%
**Layer: Conv3**
* Trend: Consistent increase from T1 to T10.
* Approximate Values:
* T1 (Blue): ~8%
* T2 (Orange): ~40%
* T3 (Green): ~46%
* T4 (Red): ~49%
* T5 (Purple): ~59%
* T6 (Brown): ~60%
* T7 (Pink): ~61%
* T8 (Gray): ~67%
* T9 (Olive): ~67%
* T10 (Cyan): ~70%
**Layer: Conv4**
* Trend: Consistent increase from T1 to T10.
* Approximate Values:
* T1 (Blue): ~6%
* T2 (Orange): ~33%
* T3 (Green): ~36%
* T4 (Red): ~41%
* T5 (Purple): ~49%
* T6 (Brown): ~51%
* T7 (Pink): ~53%
* T8 (Gray): ~57%
* T9 (Olive): ~58%
* T10 (Cyan): ~62%
**Layer: Conv5**
* Trend: Consistent increase from T1 to T10.
* Approximate Values:
* T1 (Blue): ~5%
* T2 (Orange): ~32%
* T3 (Green): ~35%
* T4 (Red): ~41%
* T5 (Purple): ~47%
* T6 (Brown): ~50%
* T7 (Pink): ~53%
* T8 (Gray): ~57%
* T9 (Olive): ~58%
* T10 (Cyan): ~62%
**Layer: FC0**
* Trend: Consistent increase from T1 to T10.
* Approximate Values:
* T1 (Blue): ~6%
* T2 (Orange): ~33%
* T3 (Green): ~39%
* T4 (Red): ~45%
* T5 (Purple): ~52%
* T6 (Brown): ~55%
* T7 (Pink): ~58%
* T8 (Gray): ~60%
* T9 (Olive): ~62%
* T10 (Cyan): ~65%
**Layer: FC1**
* Trend: Consistent increase from T1 to T10.
* Approximate Values:
* T1 (Blue): ~6%
* T2 (Orange): ~33%
* T3 (Green): ~37%
* T4 (Red): ~41%
* T5 (Purple): ~45%
* T6 (Brown): ~48%
* T7 (Pink): ~51%
* T8 (Gray): ~53%
* T9 (Olive): ~54%
* T10 (Cyan): ~55%
### Key Observations
1. **Universal Intra-Layer Trend:** In every single layer group (Conv0 through FC1), the "Used Weights [%]" monotonically increases from T1 (lowest) to T10 (highest). This is the most dominant pattern in the chart.
2. **General Inter-Layer Trend:** The overall magnitude of used weights is highest in the earliest layer (`Conv0`, peaking at ~100%) and generally decreases for subsequent layers. The later fully connected layers (`FC0`, `FC1`) show the lowest overall percentages (peaking at ~65% and ~55%, respectively).
3. **T1 Baseline:** The T1 series (blue bars) consistently represents the lowest percentage of used weights in every layer, ranging from ~35% in `Conv0` down to ~5-6% in the later layers.
4. **T10 Ceiling:** The T10 series (cyan bars) consistently represents the highest percentage of used weights in every layer.
5. **Layer Similarity:** The patterns for `Conv4`, `Conv5`, `FC0`, and `FC1` are visually very similar in both shape and magnitude, suggesting a plateau or convergence in behavior in the deeper parts of the network.
### Interpretation
This chart likely visualizes the results of a neural network pruning or sparsity analysis experiment. The "T" series (T1-T10) probably represent different thresholds or levels of a pruning algorithm, where T1 is the most aggressive (pruning the most weights, leaving only ~5-35% "used") and T10 is the least aggressive (pruning the least, leaving ~55-100% "used").
The data demonstrates two key findings:
1. **Layer Sensitivity:** Earlier convolutional layers (`Conv0`, `Conv1`) can sustain a much higher percentage of used weights (are less sparse) under the same pruning thresholds compared to later layers. This suggests earlier layers contain more critical, dense information that is retained even under moderate pruning pressure.
2. **Threshold Consistency:** The effect of the pruning threshold (T1 vs. T10) is remarkably consistent across all layers. Increasing the threshold from T1 to T10 always leads to a higher percentage of retained weights, regardless of the layer's position in the network. This indicates the pruning method applies a uniform relative effect across the model's architecture.
The notable outlier is `Conv0` at T10, which retains nearly 100% of its weights, indicating this initial layer is almost entirely preserved under the least aggressive pruning setting. The convergence of patterns in the deeper layers (`Conv4` onwards) suggests these layers have a similar, more sparse structure that is less differentiated by the pruning thresholds compared to the early layers.
DECODING INTELLIGENCE...