## Bar Chart: Used Weights (%) by Layer and Test Type
### Overview
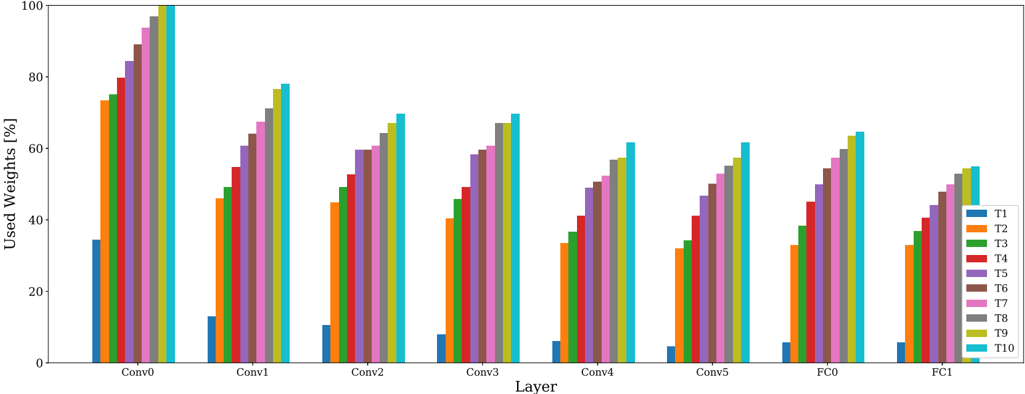
The chart displays the percentage of "Used Weights" across 10 test types (T1–T10) for 8 neural network layers (Conv0–FC1). Each layer has 10 colored bars representing test types, with values ranging from 0% to 100% on the y-axis.
### Components/Axes
- **X-axis (Layers)**: Labeled "Conv0" to "FC1" (8 categories).
- **Y-axis (Used Weights)**: Scaled from 0% to 100% in 20% increments.
- **Legend**: Right-aligned, mapping test types (T1–T10) to colors:
- T1: Blue
- T2: Orange
- T3: Green
- T4: Red
- T5: Purple
- T6: Brown
- T7: Pink
- T8: Gray
- T9: Yellow
- T10: Cyan
### Detailed Analysis
- **Conv0**:
- T1: ~35% (blue)
- T2: ~75% (orange)
- T3: ~75% (green)
- T4: ~80% (red)
- T5: ~85% (purple)
- T6: ~90% (brown)
- T7: ~95% (pink)
- T8: ~95% (gray)
- T9: ~100% (yellow)
- T10: ~100% (cyan)
- **Conv1**:
- T1: ~12% (blue)
- T2: ~45% (orange)
- T3: ~50% (green)
- T4: ~60% (red)
- T5: ~65% (purple)
- T6: ~70% (brown)
- T7: ~75% (pink)
- T8: ~75% (gray)
- T9: ~78% (yellow)
- T10: ~78% (cyan)
- **Conv2**:
- T1: ~10% (blue)
- T2: ~45% (orange)
- T3: ~50% (green)
- T4: ~55% (red)
- T5: ~60% (purple)
- T6: ~65% (brown)
- T7: ~65% (pink)
- T8: ~70% (gray)
- T9: ~70% (yellow)
- T10: ~70% (cyan)
- **Conv3**:
- T1: ~6% (blue)
- T2: ~40% (orange)
- T3: ~45% (green)
- T4: ~50% (red)
- T5: ~55% (purple)
- T6: ~60% (brown)
- T7: ~65% (pink)
- T8: ~65% (gray)
- T9: ~68% (yellow)
- T10: ~68% (cyan)
- **Conv4**:
- T1: ~5% (blue)
- T2: ~35% (orange)
- T3: ~38% (green)
- T4: ~42% (red)
- T5: ~48% (purple)
- T6: ~52% (brown)
- T7: ~55% (pink)
- T8: ~58% (gray)
- T9: ~60% (yellow)
- T10: ~60% (cyan)
- **Conv5**:
- T1: ~4% (blue)
- T2: ~30% (orange)
- T3: ~35% (green)
- T4: ~40% (red)
- T5: ~45% (purple)
- T6: ~50% (brown)
- T7: ~55% (pink)
- T8: ~58% (gray)
- T9: ~60% (yellow)
- T10: ~60% (cyan)
- **FC0**:
- T1: ~5% (blue)
- T2: ~35% (orange)
- T3: ~38% (green)
- T4: ~42% (red)
- T5: ~48% (purple)
- T6: ~52% (brown)
- T7: ~55% (pink)
- T8: ~58% (gray)
- T9: ~60% (yellow)
- T10: ~60% (cyan)
- **FC1**:
- T1: ~4% (blue)
- T2: ~30% (orange)
- T3: ~35% (green)
- T4: ~40% (red)
- T5: ~45% (purple)
- T6: ~50% (brown)
- T7: ~55% (pink)
- T8: ~58% (gray)
- T9: ~60% (yellow)
- T10: ~60% (cyan)
### Key Observations
1. **T10 Dominance**: T10 consistently has the highest percentage (100% in Conv0, ~60% in later layers).
2. **T1 Consistency**: T1 has the lowest percentage across all layers (~3–35%).
3. **Layer-Specific Trends**:
- Conv0 shows the highest overall weights (up to 100%).
- Later layers (Conv4–FC1) exhibit lower percentages, with T10 decreasing from 100% to ~60%.
4. **Color Consistency**: All legend colors match bar colors exactly (e.g., T1 = blue in all layers).
### Interpretation
The data suggests that test type T10 is the most utilized across all layers, while T1 is the least. The decline in "Used Weights" percentages from Conv0 to FC1 may indicate reduced weight utilization in deeper layers or differences in test type sensitivity. T10’s dominance could reflect its role as a primary evaluation metric, while T1’s low values might indicate a specialized or less impactful test. The uniformity of T10’s high values across layers suggests it is a critical factor in weight utilization.