\n
## Horizontal Bar Chart: Answer Confidence Score (expertise queries)
### Overview
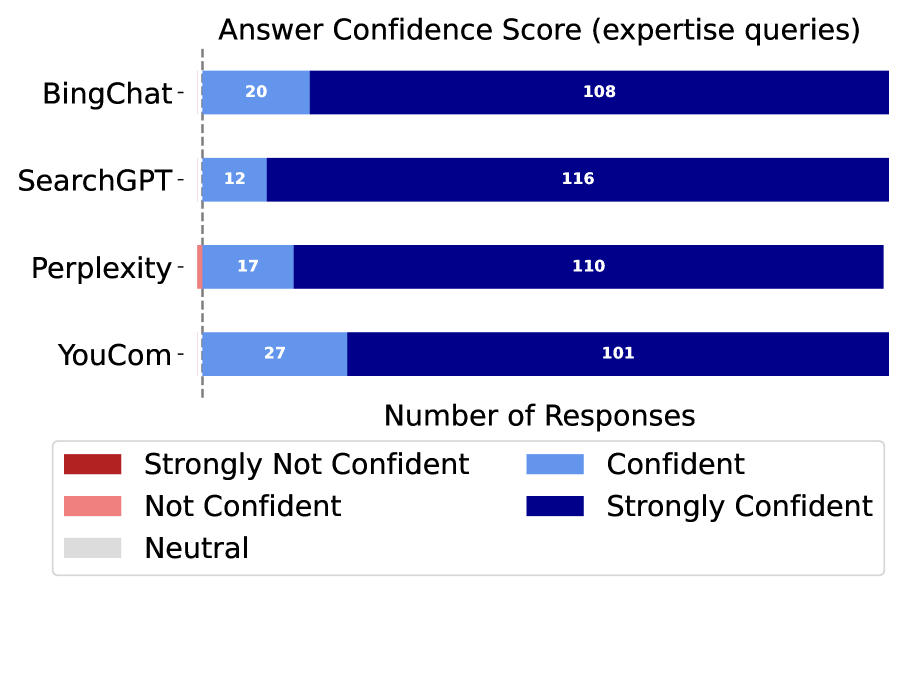
This is a horizontal bar chart comparing the answer confidence scores of four different AI models (BingChat, SearchGPT, Perplexity, and YouCom) based on "expertise queries". The chart displays the number of responses categorized by confidence level for each model.
### Components/Axes
* **Y-axis (Vertical):** Lists the AI models: BingChat, SearchGPT, Perplexity, and YouCom.
* **X-axis (Horizontal):** Represents the "Number of Responses". The scale is not explicitly marked, but values are provided for each confidence level.
* **Legend (Bottom-Center):** Defines the color coding for confidence levels:
* Red: Strongly Not Confident
* Light Red: Not Confident
* Light Gray: Neutral
* Light Blue: Confident
* Dark Blue: Strongly Confident
* **Title (Top-Center):** "Answer Confidence Score (expertise queries)"
### Detailed Analysis
Each AI model is represented by a horizontal bar divided into colored segments representing the number of responses falling into each confidence category.
* **BingChat:**
* Strongly Not Confident: Approximately 20 responses.
* Confident: Approximately 108 responses.
* **SearchGPT:**
* Strongly Not Confident: Approximately 12 responses.
* Confident: Approximately 116 responses.
* **Perplexity:**
* Strongly Not Confident: Approximately 17 responses.
* Confident: Approximately 110 responses.
* **YouCom:**
* Strongly Not Confident: Approximately 27 responses.
* Confident: Approximately 101 responses.
The bars are arranged vertically, with BingChat at the top and YouCom at the bottom. The length of each colored segment corresponds to the number of responses in that confidence category.
### Key Observations
* All four models show a significantly higher number of "Confident" responses compared to "Strongly Not Confident" responses.
* YouCom has the highest number of "Strongly Not Confident" responses (approximately 27), while BingChat has the lowest (approximately 20).
* SearchGPT has the highest number of "Confident" responses (approximately 116), while YouCom has the lowest (approximately 101).
* There are no responses in the "Not Confident" or "Neutral" categories for any of the models.
### Interpretation
The chart suggests that all four AI models generally exhibit a high degree of confidence in their answers to expertise queries. However, there are noticeable differences in the distribution of confidence levels between the models. SearchGPT appears to be the most consistently confident, while YouCom exhibits the highest proportion of responses with low confidence. The absence of responses in the "Not Confident" and "Neutral" categories could indicate a bias in how the models are calibrated or how responses are categorized. The data implies that while these models are capable of providing answers to complex questions, the reliability of those answers varies between models, with SearchGPT appearing to be the most reliable based on this metric. The chart does not provide information about the *accuracy* of the confident responses, only the *confidence* level reported by the models themselves. Further investigation would be needed to determine the actual correctness of the answers.