## Horizontal Stacked Bar Chart: Answer Confidence Score (expertise queries)
### Overview
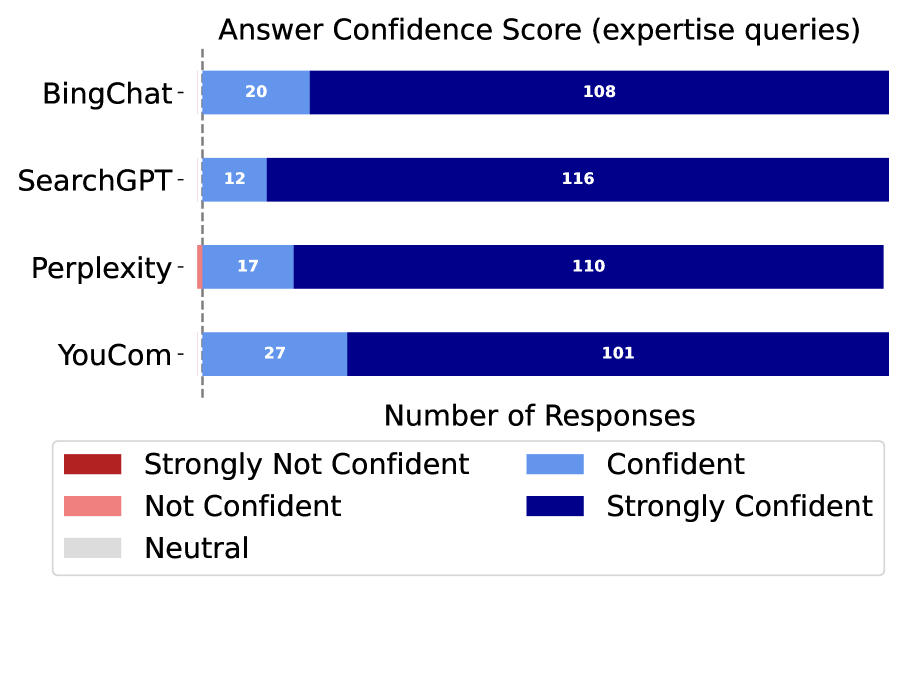
This image displays a horizontal stacked bar chart comparing the confidence levels of responses from four different AI systems (BingChat, SearchGPT, Perplexity, YouCom) to a set of "expertise queries." The chart quantifies the number of responses falling into five distinct confidence categories.
### Components/Axes
* **Chart Title:** "Answer Confidence Score (expertise queries)" (Top center).
* **Vertical Axis (Y-axis):** Lists the four AI systems being compared. From top to bottom: "BingChat", "SearchGPT", "Perplexity", "YouCom".
* **Horizontal Axis (X-axis):** Labeled "Number of Responses" (Bottom center). The axis has a dashed vertical line at the zero point, aligned with the start of each bar.
* **Legend:** Located at the bottom of the chart, centered. It defines five color-coded categories:
* **Strongly Not Confident:** Dark red square.
* **Not Confident:** Light red/salmon square.
* **Neutral:** Light gray square.
* **Confident:** Light blue square.
* **Strongly Confident:** Dark blue square.
### Detailed Analysis
Each horizontal bar represents the total responses for one AI system, segmented by confidence level. The numerical value for each major segment is labeled directly on the bar.
**1. BingChat (Top Bar):**
* **Confident (Light Blue):** 20 responses.
* **Strongly Confident (Dark Blue):** 108 responses.
* **Other Segments:** A very thin, unlabeled gray segment (Neutral) is visible between the "Confident" and "Strongly Confident" segments. No red segments are visible.
**2. SearchGPT (Second Bar):**
* **Confident (Light Blue):** 12 responses.
* **Strongly Confident (Dark Blue):** 116 responses.
* **Other Segments:** A very thin, unlabeled gray segment (Neutral) is visible. No red segments are visible.
**3. Perplexity (Third Bar):**
* **Strongly Not Confident (Dark Red):** A very small, unlabeled segment is visible at the far left.
* **Confident (Light Blue):** 17 responses.
* **Strongly Confident (Dark Blue):** 110 responses.
* **Other Segments:** A thin, unlabeled gray segment (Neutral) is visible.
**4. YouCom (Bottom Bar):**
* **Confident (Light Blue):** 27 responses.
* **Strongly Confident (Dark Blue):** 101 responses.
* **Other Segments:** A thin, unlabeled gray segment (Neutral) is visible. No red segments are visible.
**Trend Verification:**
* For all four systems, the "Strongly Confident" (dark blue) segment is the largest component of the bar, indicating it is the most frequent confidence rating.
* The "Confident" (light blue) segment is the second-largest for all systems.
* The combined "Confident" and "Strongly Confident" segments constitute the vast majority of responses for each system.
### Key Observations
1. **Dominance of High Confidence:** Across all four AI systems, the overwhelming majority of responses are categorized as either "Confident" or "Strongly Confident."
2. **Highest "Strongly Confident" Count:** SearchGPT has the highest number of "Strongly Confident" responses (116).
3. **Highest "Confident" Count:** YouCom has the highest number of "Confident" responses (27).
4. **Lowest "Confident" Count:** SearchGPT has the lowest number of "Confident" responses (12).
5. **Presence of Low Confidence:** Perplexity is the only system with a visible "Strongly Not Confident" (dark red) segment, though it is very small.
6. **Neutral Responses:** All four systems show a very small, unlabeled "Neutral" (gray) segment, suggesting a minimal number of responses were rated as neutral.
### Interpretation
The data suggests that when responding to queries requiring expertise, these four AI systems predominantly project high confidence. The "Strongly Confident" category is the modal response for each, indicating a tendency towards assertive answers.
The variation lies in the distribution between "Confident" and "Strongly Confident." SearchGPT shows the most polarized confidence, with the highest "Strongly Confident" count but the lowest "Confident" count. YouCom shows a slightly more balanced distribution between the two top categories.
The presence of a "Strongly Not Confident" segment only for Perplexity is a notable outlier. It indicates that, for this specific set of expertise queries, Perplexity's responses were occasionally flagged with the lowest confidence rating, a pattern not observed for the other systems in this dataset. The universally small "Neutral" segment implies that the systems rarely produce responses that are ambiguous or non-committal in their confidence.
**Important Note:** The exact numerical values for the "Neutral," "Not Confident," and "Strongly Not Confident" segments are not provided on the chart. Their sizes are inferred visually and are approximate. The analysis is based on the labeled values for the "Confident" and "Strongly Confident" segments and the visual representation of the other categories.