## Scatter Plot Matrix: Category Distribution Across Layers and Heads
### Overview
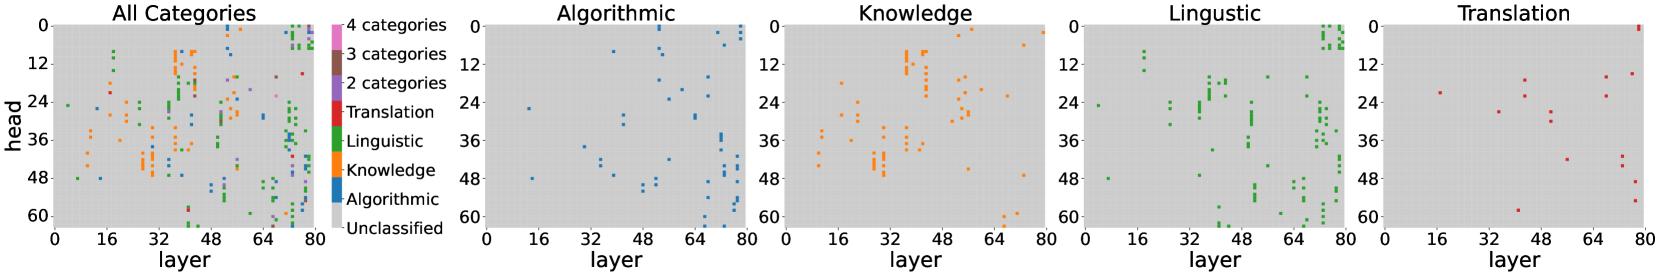
The image presents a scatter plot matrix visualizing the distribution of data points across different categories, layers, and head numbers. The main chart ("All Categories") shows all data points, while four sub-charts isolate specific categories: Algorithmic, Knowledge, Linguistic, and Translation. Each sub-chart uses a distinct color to represent its category, as defined in the legend.
### Components/Axes
- **Main Chart ("All Categories")**:
- **X-axis**: Layer (0–80, increments of 16)
- **Y-axis**: Head (0–60, increments of 12)
- **Legend**: Located on the left, mapping colors to categories:
- Pink: 4 categories
- Brown: 3 categories
- Purple: 2 categories
- Red: Translation
- Green: Linguistic
- Orange: Knowledge
- Blue: Algorithmic
- Gray: Unclassified
- **Sub-Charts**:
- Each sub-chart replicates the main chart's axes but filters data to a single category.
- Example: The "Algorithmic" sub-chart shows only blue points.
### Detailed Analysis
#### Main Chart ("All Categories")
- **Data Distribution**:
- Points are scattered across all layers (0–80) and heads (0–60).
- High-density clusters appear in layers 16–48 and heads 24–48.
- Unclassified points (gray) are sparse but present in mid-layers (32–64) and mid-heads (24–36).
#### Sub-Charts
1. **Algorithmic (Blue)**:
- Points are concentrated in layers 16–64 and heads 12–48.
- Notable cluster at layer 32, head 24.
- Sparse points in layers 64–80 and heads 48–60.
2. **Knowledge (Orange)**:
- Points cluster in layers 16–48 and heads 12–36.
- Vertical alignment at layer 32, heads 24–36.
- Few points in layers 64–80.
3. **Linguistic (Green)**:
- Points dominate layers 16–80 and heads 24–60.
- Dense cluster at layer 64, head 48.
- Sparse points in layers 0–16.
4. **Translation (Red)**:
- Points are sparse and scattered across layers 32–80 and heads 24–48.
- Notable cluster at layer 64, head 36.
- Few points in layers 0–32.
### Key Observations
1. **Category-Specific Trends**:
- **Algorithmic**: Broad distribution but concentrated in mid-layers (16–64).
- **Knowledge**: Strong vertical clustering at layer 32.
- **Linguistic**: Dominates higher layers (64–80) and mid-to-high heads (48–60).
- **Translation**: Sparse and fragmented, with no clear trend.
2. **Unclassified Data**:
- Gray points in the main chart suggest incomplete categorization, particularly in mid-layers (32–64) and mid-heads (24–36).
3. **Layer-Head Correlation**:
- Higher layers (64–80) correlate with higher head numbers (48–60) for Linguistic and Algorithmic categories.
- Translation shows no strong layer-head correlation.
### Interpretation
The data suggests that **Linguistic** and **Algorithmic** categories are more prevalent in higher layers and heads, while **Knowledge** is concentrated in mid-layers. **Translation** appears less structured, possibly indicating ambiguity in its classification. The presence of unclassified points highlights gaps in the categorization framework. These patterns may reflect domain-specific processing requirements or data generation biases in the underlying system.