## Network Diagram: Graph Visualizations
### Overview
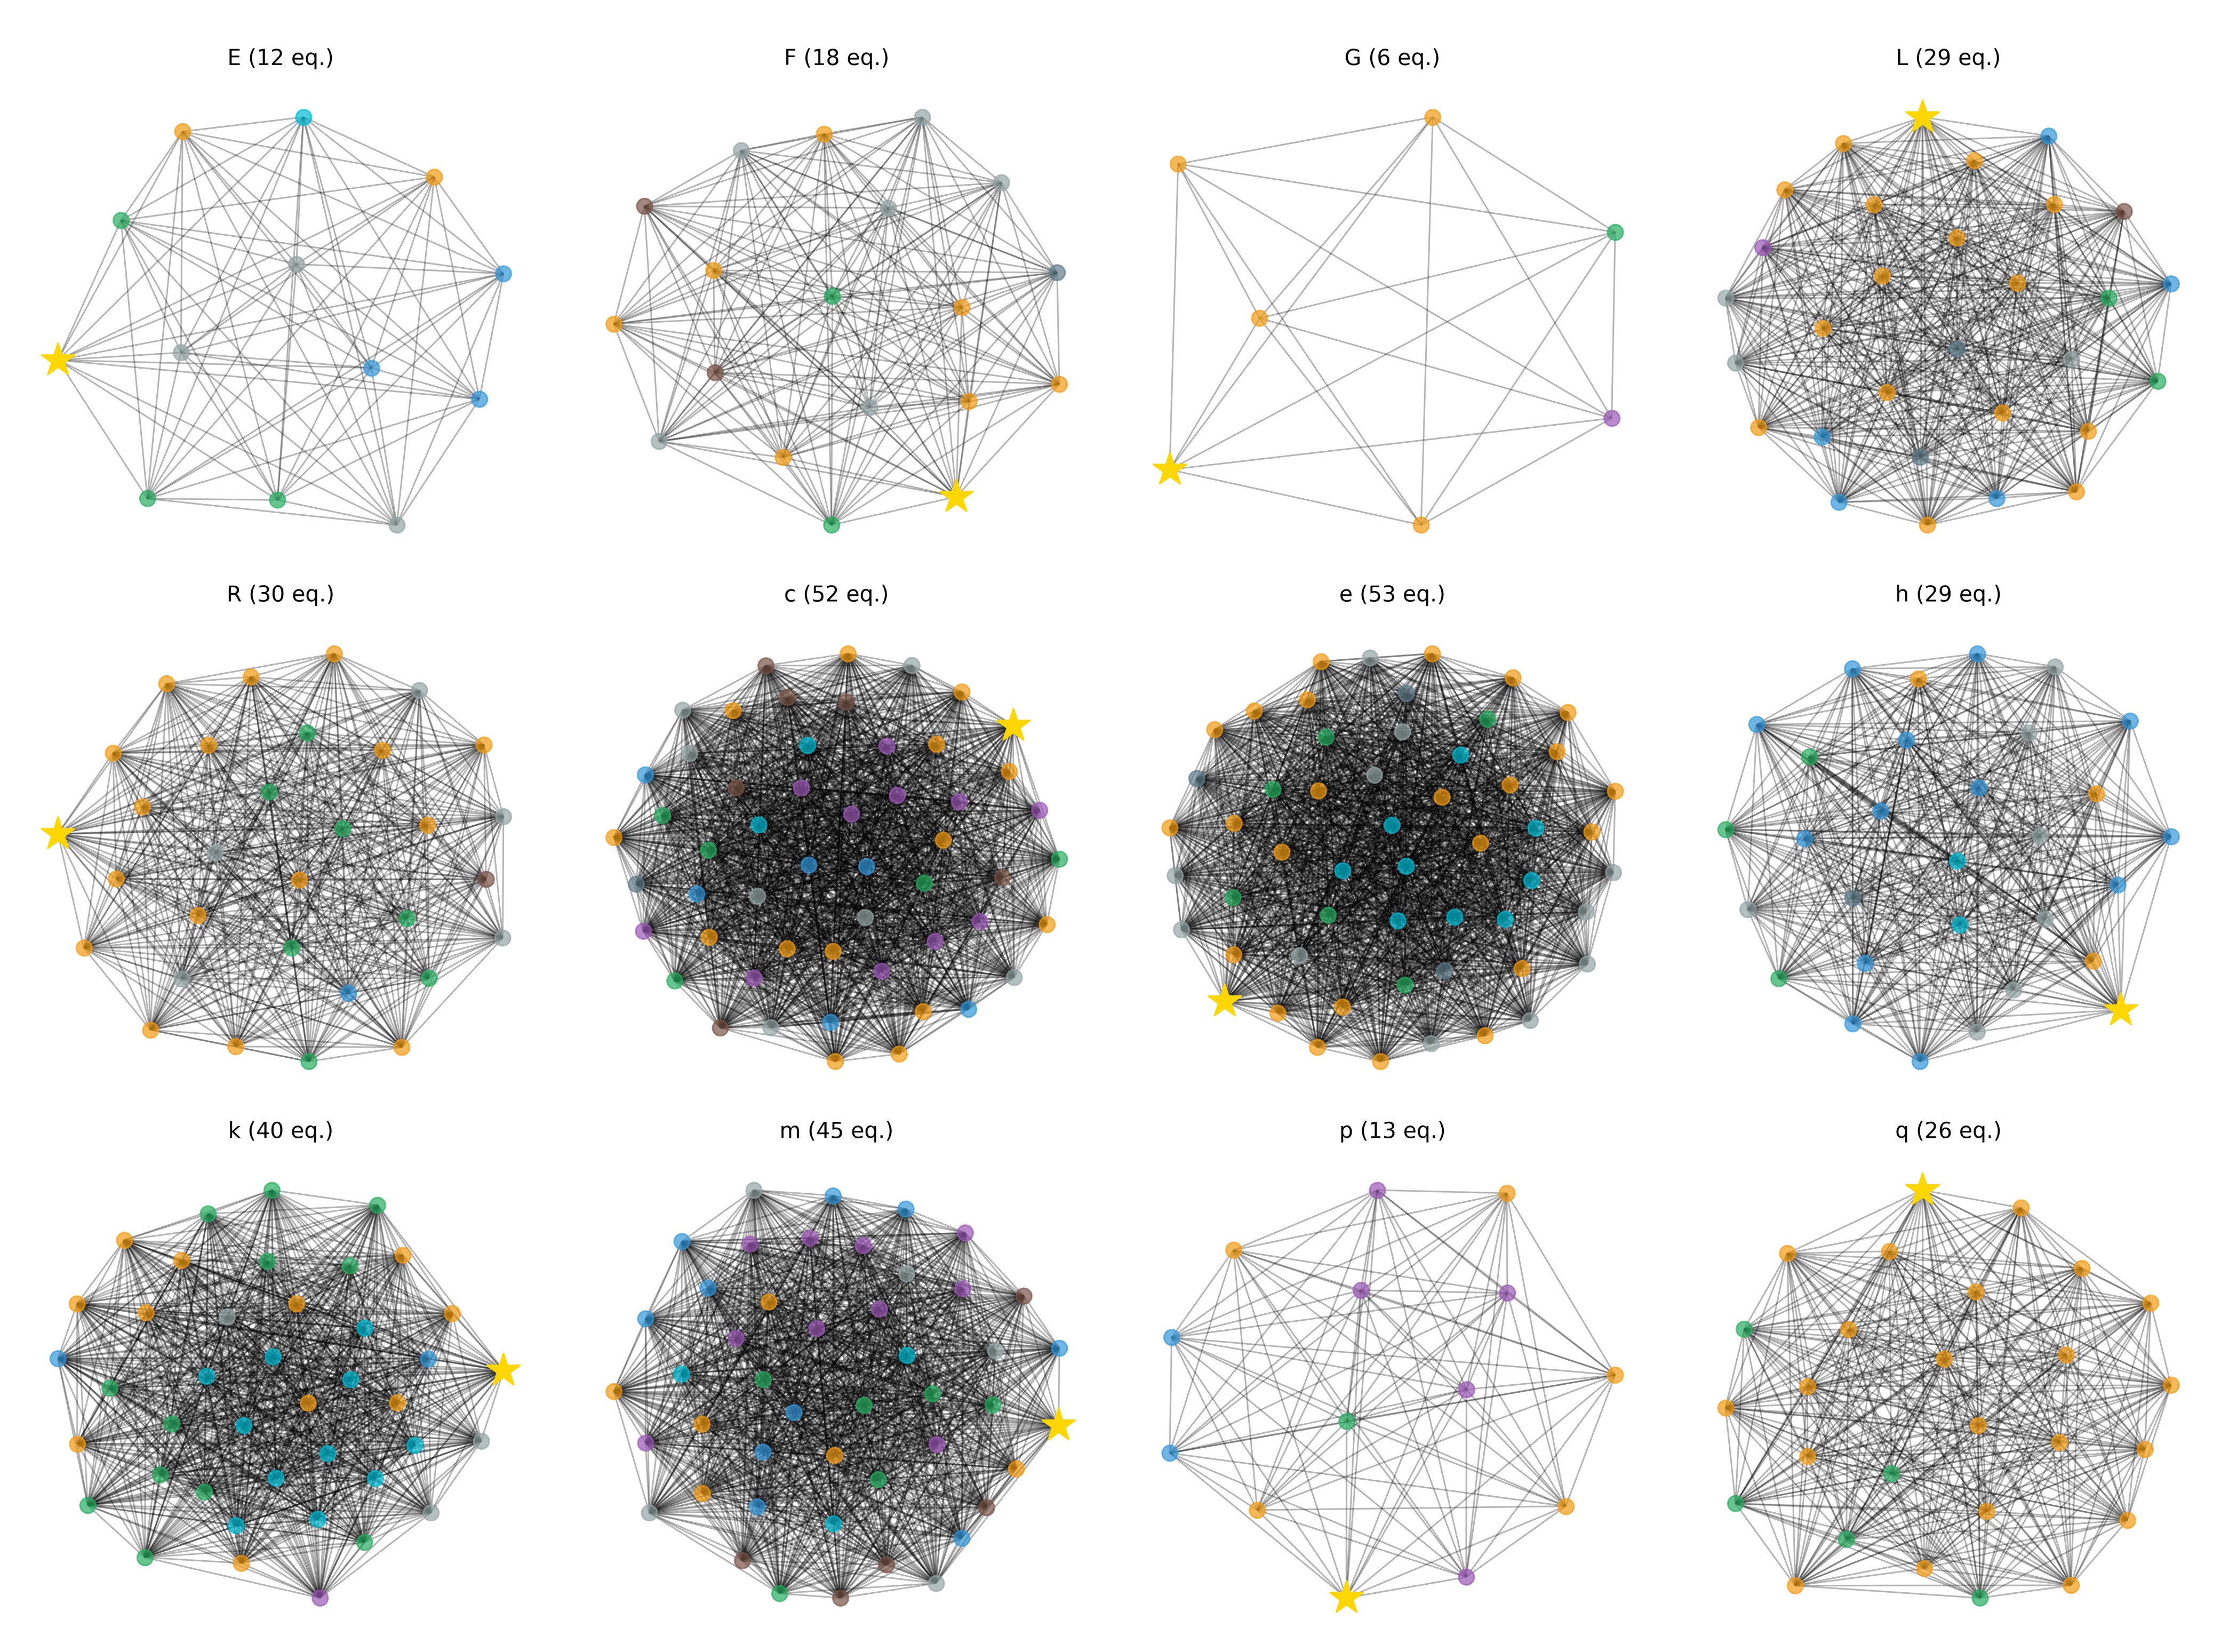
The image presents a collection of twelve network diagrams, each labeled with a letter (E, F, G, L, R, c, e, h, k, m, p, q) and a number followed by "eq.". Each diagram consists of nodes (represented by colored circles) connected by edges (represented by gray lines). A yellow star is present in each diagram, seemingly connected to other nodes. The number following the letter likely represents the number of nodes in the graph.
### Components/Axes
* **Nodes:** Represented by colored circles. The colors observed are orange, green, blue, gray, purple, and brown.
* **Edges:** Represented by gray lines connecting the nodes.
* **Labels:** Each graph is labeled with a letter and a number in parentheses, e.g., "E (12 eq.)".
* **Star:** A yellow star is present in each graph.
### Detailed Analysis or ### Content Details
Here's a breakdown of each graph:
* **E (12 eq.):** 12 nodes. Colors present: orange, green, blue, gray. The yellow star is present.
* **F (18 eq.):** 18 nodes. Colors present: orange, green, gray, brown. The yellow star is present.
* **G (6 eq.):** 6 nodes. Colors present: orange, green, purple. The yellow star is present.
* **L (29 eq.):** 29 nodes. Colors present: orange, green, blue, gray, purple, brown. The yellow star is present.
* **R (30 eq.):** 30 nodes. Colors present: orange, green, blue, gray, brown. The yellow star is present.
* **c (52 eq.):** 52 nodes. Colors present: orange, green, blue, gray, purple, brown. The yellow star is present.
* **e (53 eq.):** 53 nodes. Colors present: orange, green, blue, gray. The yellow star is present.
* **h (29 eq.):** 29 nodes. Colors present: orange, green, blue, gray. The yellow star is present.
* **k (40 eq.):** 40 nodes. Colors present: orange, green, blue, gray, purple. The yellow star is present.
* **m (45 eq.):** 45 nodes. Colors present: orange, green, blue, gray, purple, brown. The yellow star is present.
* **p (13 eq.):** 13 nodes. Colors present: orange, green, blue, gray, purple. The yellow star is present.
* **q (26 eq.):** 26 nodes. Colors present: orange, green, blue, gray. The yellow star is present.
### Key Observations
* The number of nodes varies significantly across the graphs, ranging from 6 to 53.
* The colors of the nodes are not consistent across all graphs. Some graphs have a wider variety of colors than others.
* The yellow star is a consistent element in all graphs.
* The edges (gray lines) appear to connect nodes in a complex and seemingly random manner.
### Interpretation
The image likely represents different network configurations or states, possibly related to some underlying system or process. The "eq." likely stands for "entities". The number of entities varies across the different states. The colored nodes could represent different types of entities or different states of the same entity. The yellow star could represent a central node or a node with a special property. The connections between the nodes (edges) represent relationships or interactions between the entities. Without further context, it's difficult to determine the specific meaning of these graphs, but they likely visualize the structure and connectivity of a complex system.