## Network Diagrams: Various Network Structures
### Overview
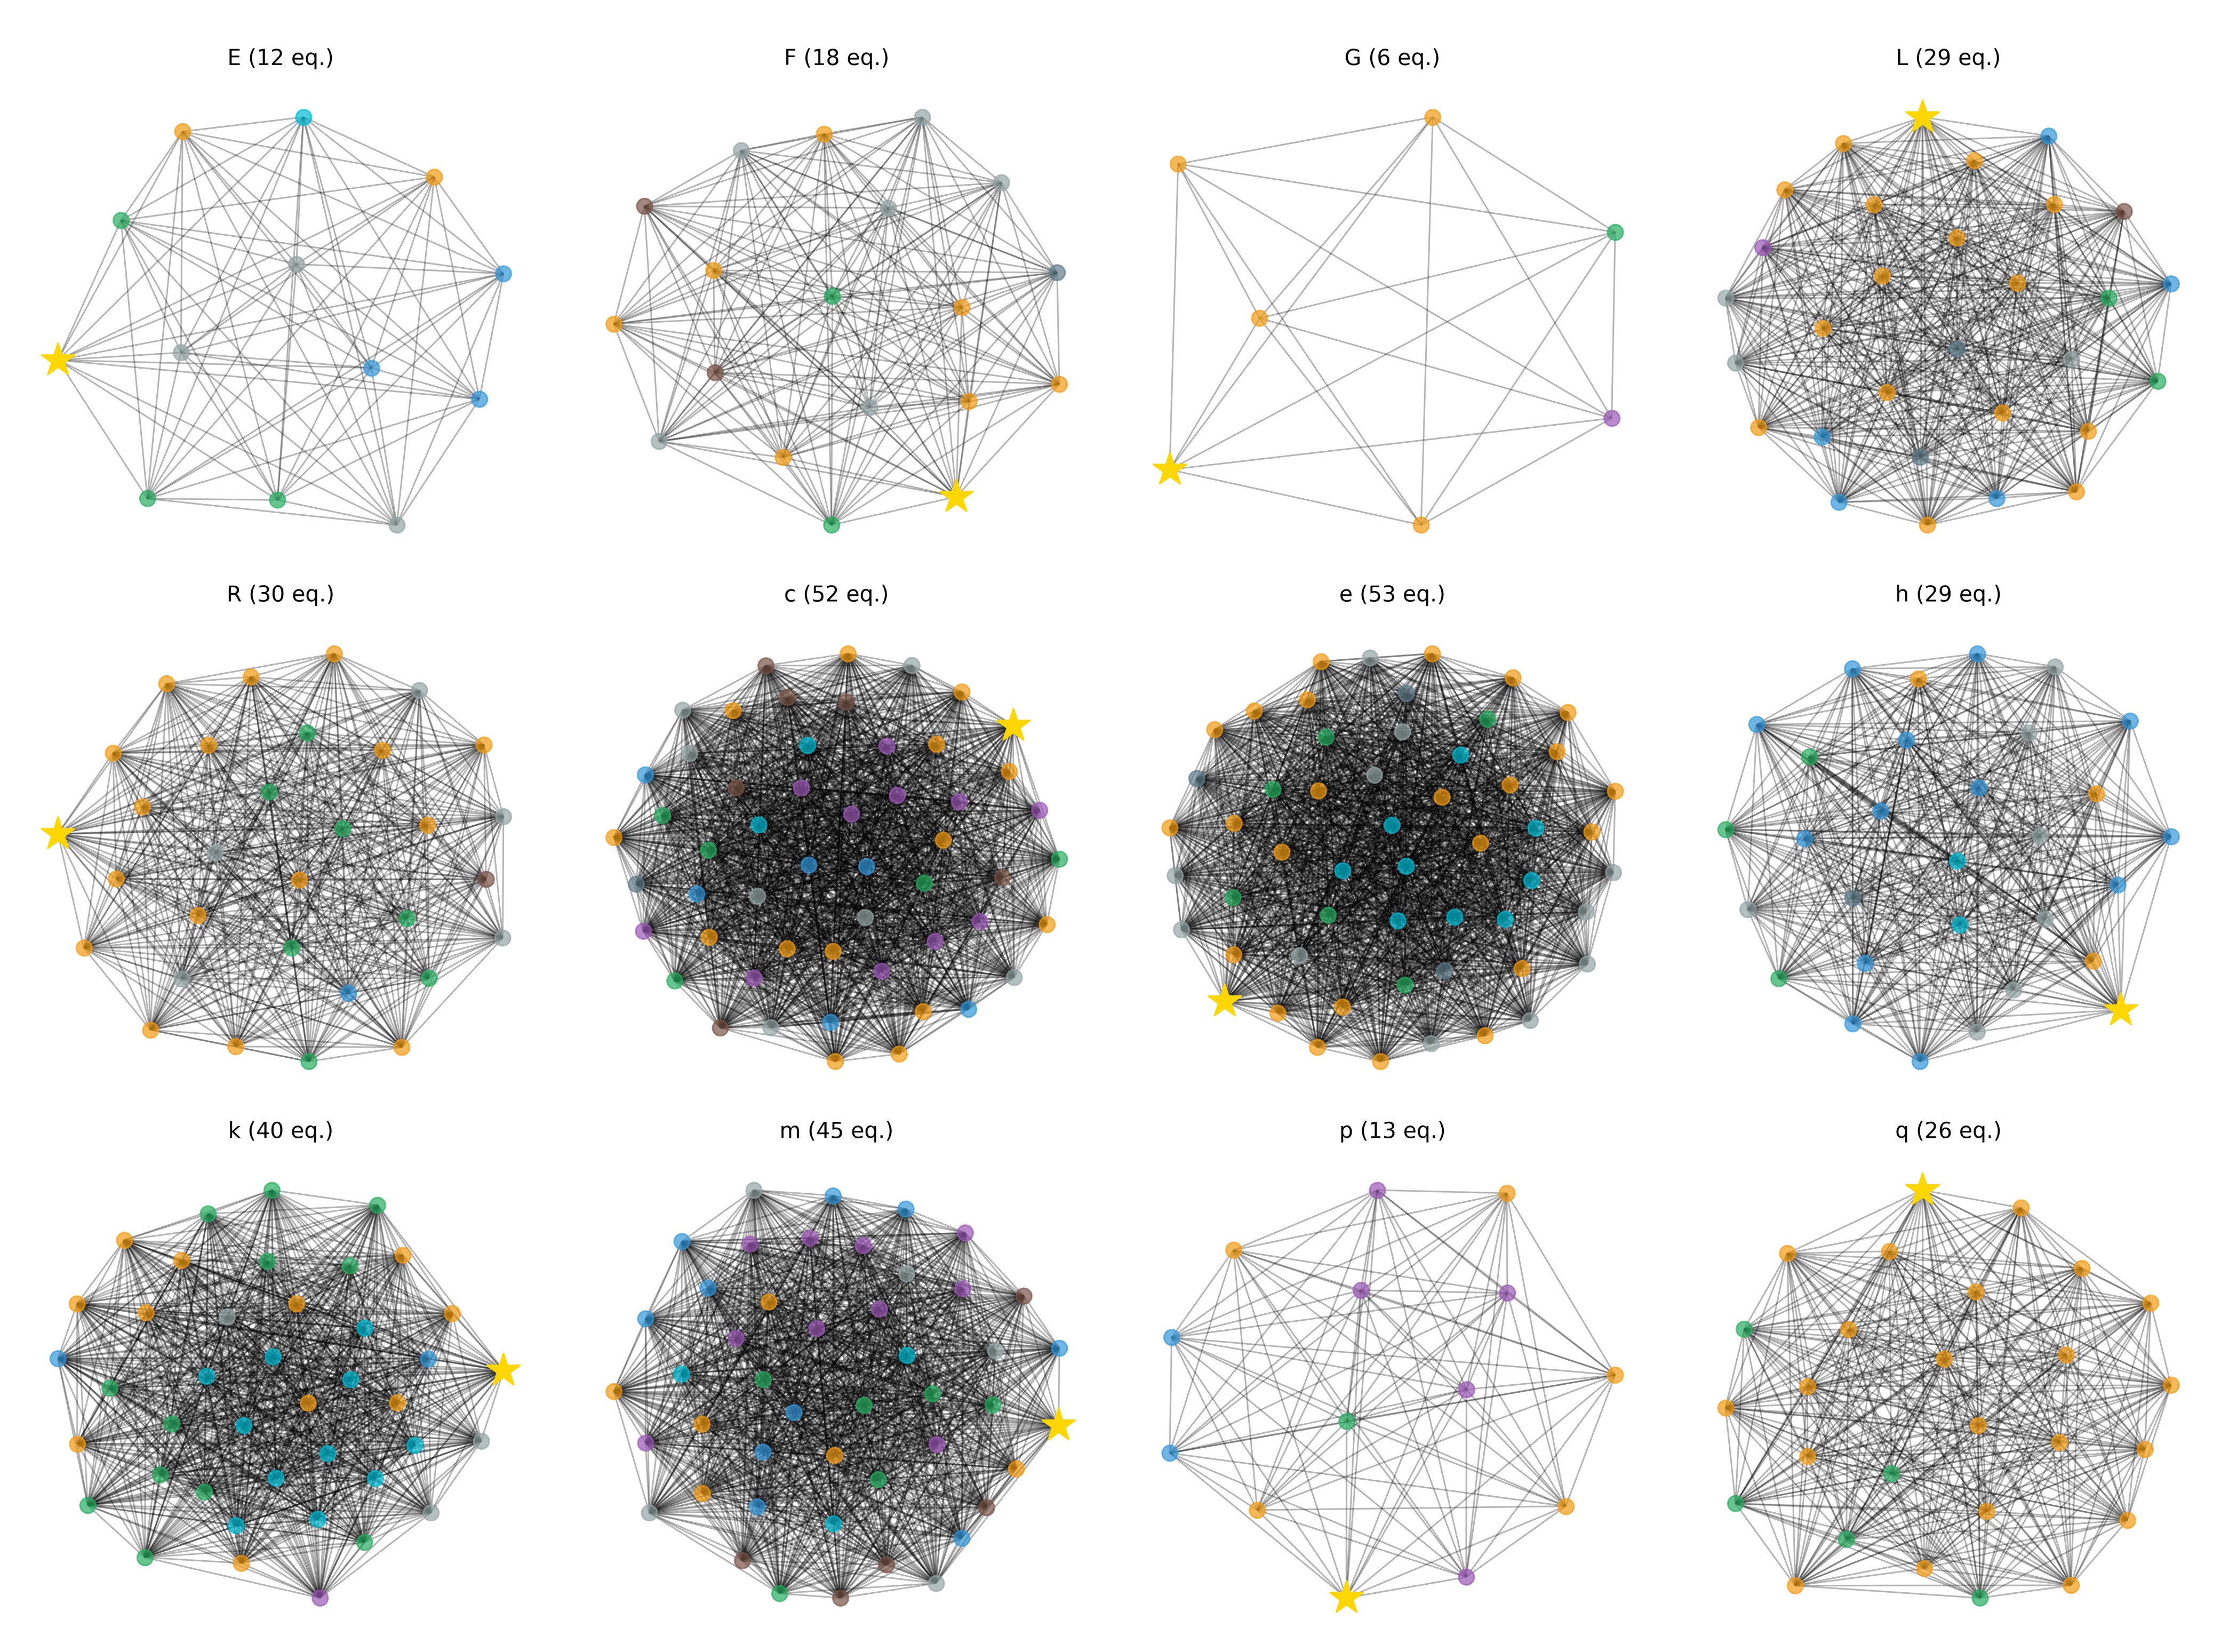
The image presents a 3x4 grid of network diagrams. Each diagram depicts a network of nodes connected by edges. Each diagram is labeled with a letter (E, F, G, L, R, C, e, h, k, m, p, q) and a number of equations (eq.). A single node in each diagram is highlighted with a yellow star. The diagrams vary significantly in their density of connections and overall structure.
### Components/Axes
There are no explicit axes in these diagrams. The components are:
* **Nodes:** Represented by small circles.
* **Edges:** Represented by lines connecting the nodes.
* **Labels:** Each diagram is labeled with a letter and the number of equations.
* **Highlighted Node:** A yellow star indicates a specific node within each network.
The labels and their corresponding equation counts are:
* E (12 eq.)
* F (18 eq.)
* G (6 eq.)
* L (29 eq.)
* R (30 eq.)
* C (52 eq.)
* e (53 eq.)
* h (29 eq.)
* k (40 eq.)
* m (45 eq.)
* p (13 eq.)
* q (26 eq.)
### Detailed Analysis or Content Details
Each diagram will be analyzed individually. Due to the complexity of visually extracting precise node counts and edge counts, only qualitative descriptions of the network structure will be provided.
* **E (12 eq.):** A relatively sparse network with nodes arranged in a roughly circular pattern. The highlighted node is near the top.
* **F (18 eq.):** A network with a more regular structure, resembling a polygon with nodes at each vertex and some internal connections. The highlighted node is near the top.
* **G (6 eq.):** A very sparse network, almost a star graph, with the highlighted node at the center.
* **L (29 eq.):** A dense network with nodes arranged in a circular pattern. The highlighted node is near the top.
* **R (30 eq.):** A very dense network, almost fully connected. The highlighted node is near the top.
* **C (52 eq.):** An extremely dense network, appearing almost as a solid mass of connections. The highlighted node is near the top.
* **e (53 eq.):** Similar to 'C', an extremely dense network. The highlighted node is near the top.
* **h (29 eq.):** A dense network with nodes arranged in a circular pattern. The highlighted node is near the top.
* **k (40 eq.):** A very dense network, almost fully connected. The highlighted node is near the top.
* **m (45 eq.):** An extremely dense network, appearing almost as a solid mass of connections. The highlighted node is near the top.
* **p (13 eq.):** A relatively sparse network with nodes arranged in a roughly circular pattern. The highlighted node is near the top.
* **q (26 eq.):** A dense network with nodes arranged in a circular pattern. The highlighted node is near the top.
All highlighted nodes appear to be positioned near the top of their respective diagrams.
### Key Observations
* The networks vary significantly in their density, ranging from very sparse (G) to extremely dense (C, e, m).
* The number of equations (eq.) appears to correlate with the density of the network; denser networks generally have higher equation counts.
* The highlighted node is consistently positioned near the top of each diagram, suggesting a potential focus on nodes with similar characteristics or roles within each network.
* The arrangement of nodes in many diagrams suggests a circular or polygonal structure.
### Interpretation
The image likely represents a comparison of different network structures, possibly derived from various mathematical models or real-world systems. The "eq." label suggests that these networks are associated with a set of equations that define their behavior or properties. The varying densities and structures indicate different levels of connectivity and complexity.
The consistent highlighting of nodes near the top of each diagram could indicate that these nodes represent key elements or central points within their respective networks. This could be due to their degree (number of connections), centrality (importance within the network), or other relevant metrics.
The correlation between network density and the number of equations suggests that more complex networks require more equations to describe their behavior. This is consistent with the idea that the number of parameters needed to model a system increases with its complexity.
The image could be used to illustrate the diversity of network structures and the trade-offs between complexity, connectivity, and the number of parameters needed to model a system. It could also be used to explore the role of key nodes in different network topologies. The image does not provide any information about the meaning of the letters (E, F, G, etc.) or the specific context of these networks. Further information would be needed to fully interpret the significance of these diagrams.