## Network Diagram Analysis: Labeled Configurations with Equation Counts
### Overview
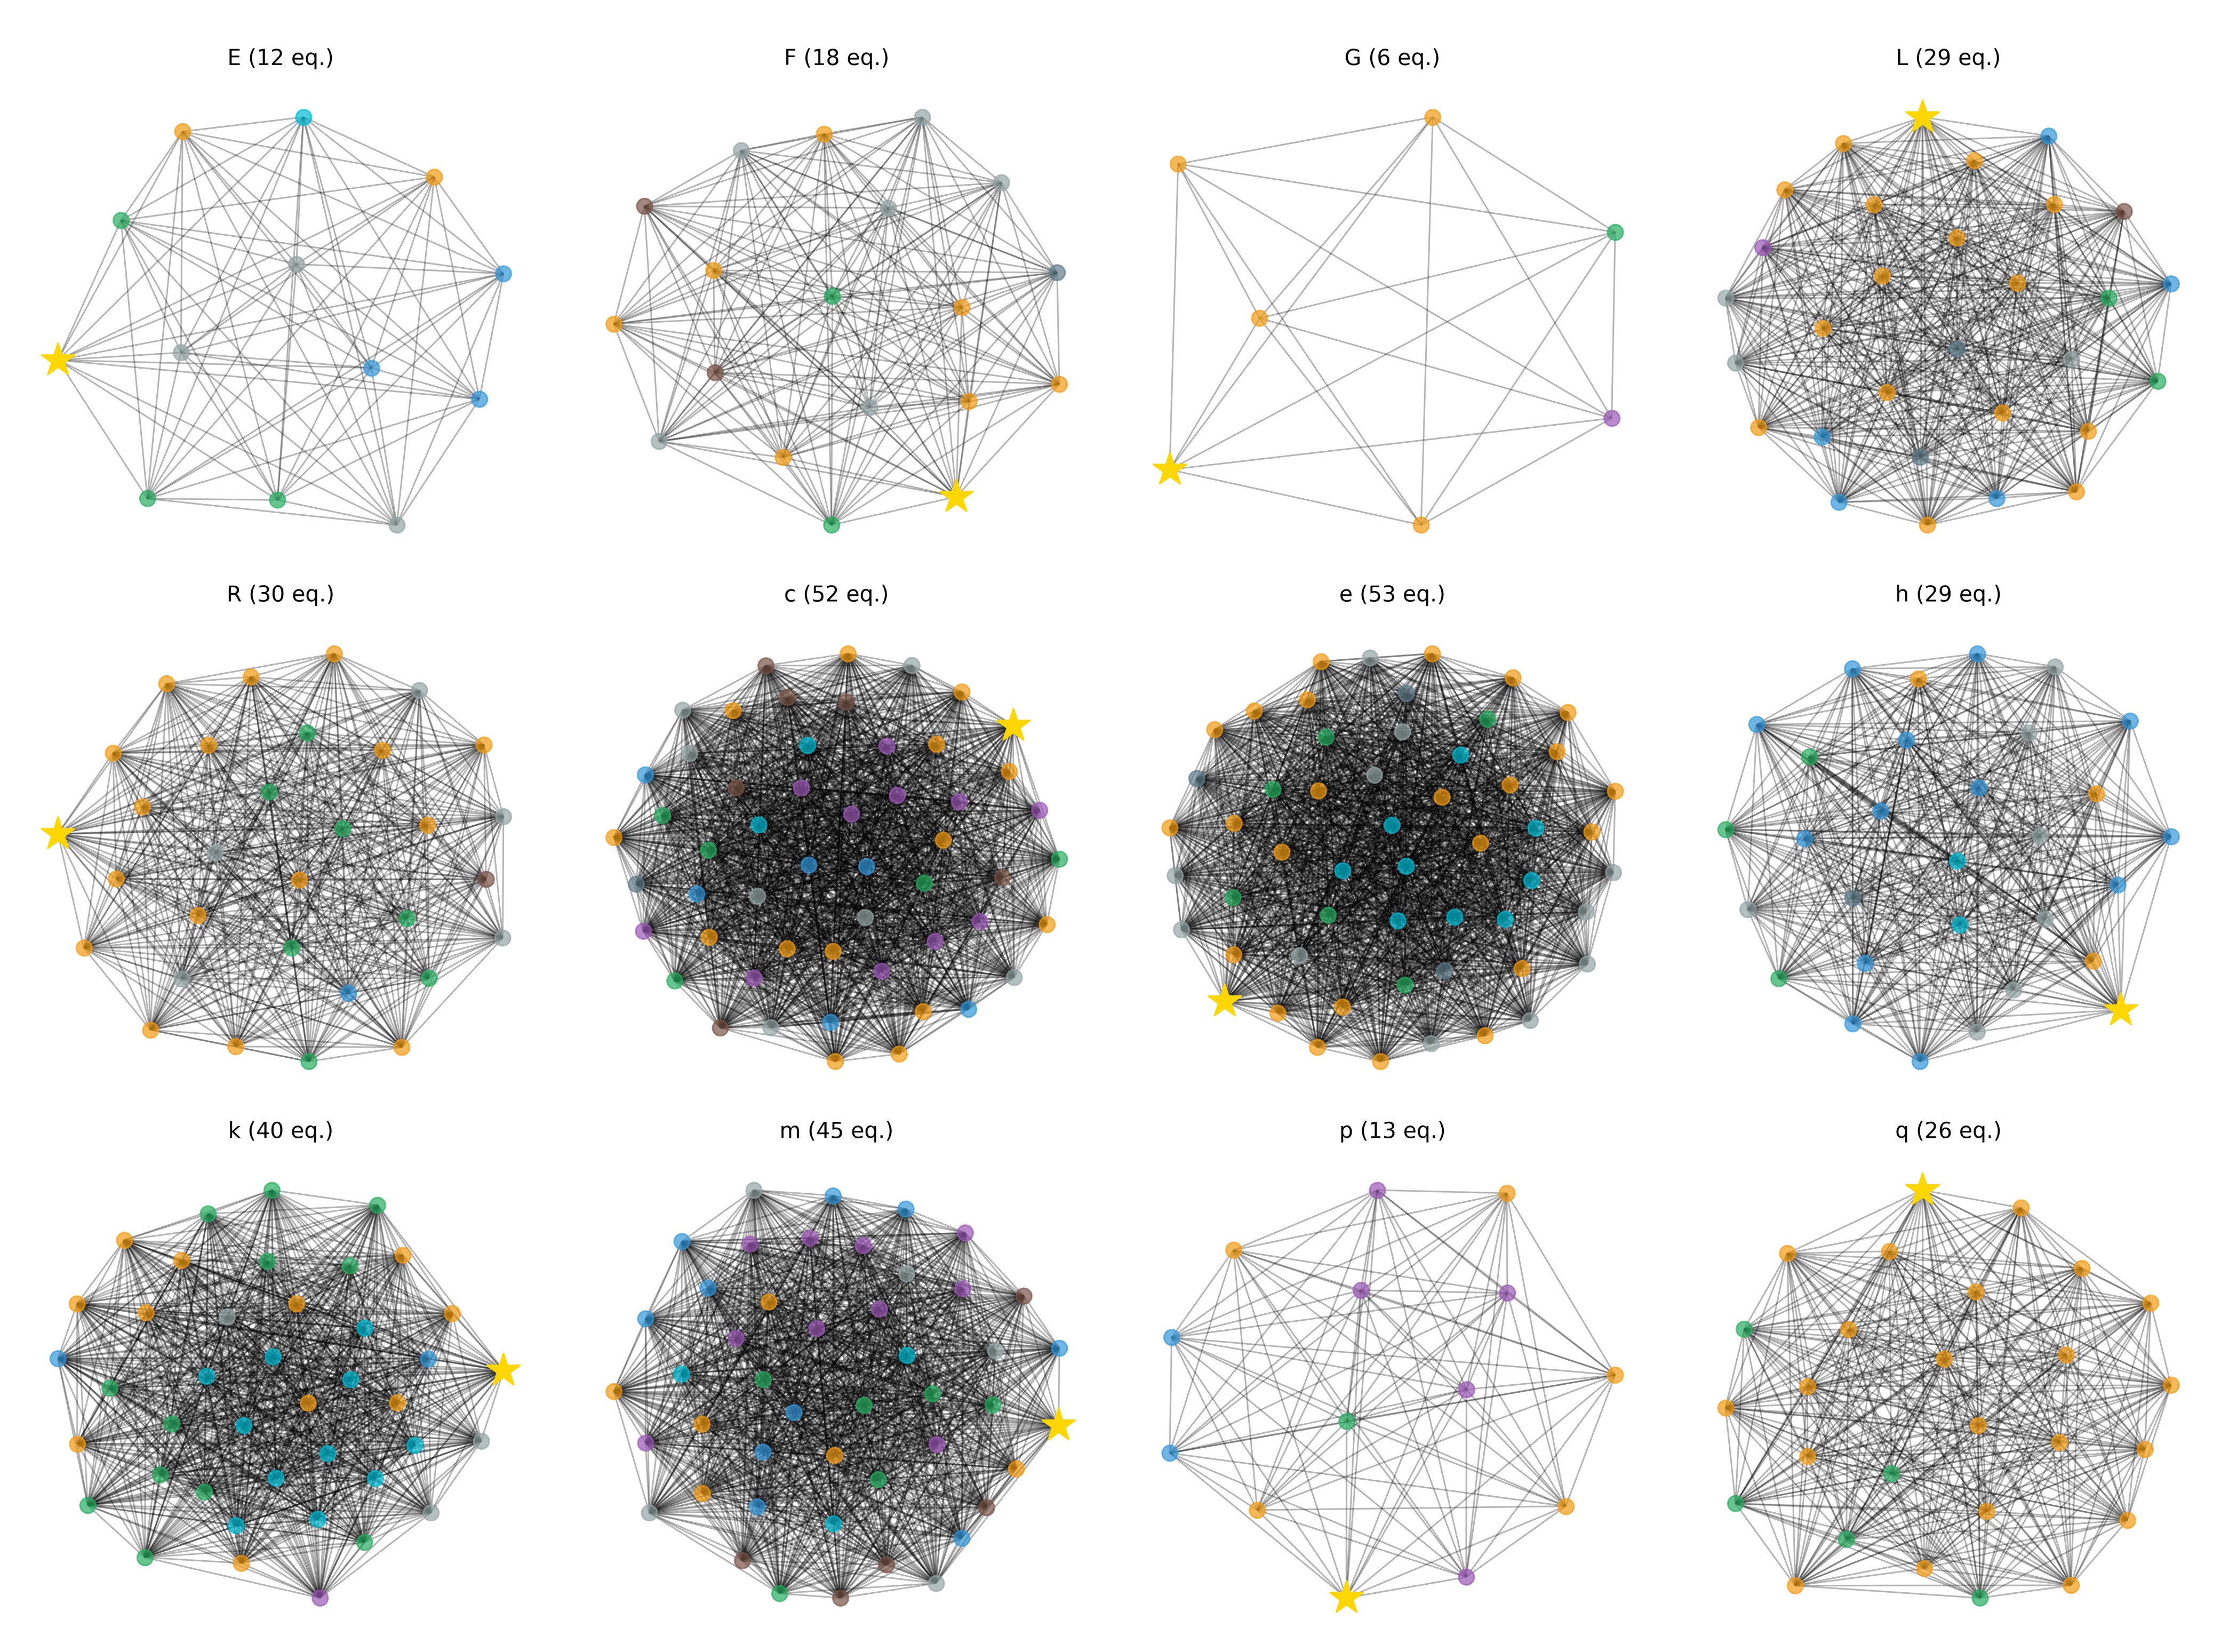
The image displays 12 network diagrams arranged in a 3x4 grid, each labeled with a letter (E–q) and an equation count in parentheses. All diagrams feature a yellow star node and interconnected nodes in distinct colors (orange, blue, green, gray, brown, purple). The diagrams vary in complexity, node density, and star positioning, suggesting different network configurations or models.
---
### Components/Axes
- **Legend**: Located on the right side of the grid, mapping colors to node types:
- Yellow star: Central/focal node
- Orange: Primary nodes
- Blue: Secondary nodes
- Green: Tertiary nodes
- Gray: Quaternary nodes
- Brown: Quinary nodes
- Purple: Senary nodes
- **Diagram Labels**: Titles at the top of each diagram (e.g., "E (12 eq.)", "F (18 eq.)").
- **Node Connections**: Black lines represent edges; density varies across diagrams.
- **Star Positioning**: The yellow star node appears in different locations (e.g., top-left in E, bottom-right in q).
---
### Detailed Analysis
1. **Diagram E (12 eq.)**:
- Star in top-left, connected to 3 orange and 2 blue nodes.
- Sparse connections; 12 equations suggest minimal complexity.
2. **Diagram F (18 eq.)**:
- Star in bottom-right, linked to 4 orange and 3 green nodes.
- Moderate density; 18 equations imply intermediate complexity.
3. **Diagram G (6 eq.)**:
- Star in top-left, connected to 2 orange and 1 purple node.
- Minimal connections; 6 equations indicate simplicity.
4. **Diagram L (29 eq.)**:
- Star in top-center, surrounded by 5 orange, 4 blue, and 3 green nodes.
- High density; 29 equations suggest complex interactions.
5. **Diagram R (30 eq.)**:
- Star in top-left, connected to 6 orange and 5 gray nodes.
- Dense network; 30 equations imply high parameter count.
6. **Diagram c (52 eq.)**:
- Star in top-right, linked to 7 orange, 6 blue, and 5 green nodes.
- Extremely dense; 52 equations indicate maximum complexity.
7. **Diagram e (53 eq.)**:
- Star in bottom-left, connected to 8 orange, 7 blue, and 6 green nodes.
- Most interconnected; 53 equations suggest peak complexity.
8. **Diagram h (29 eq.)**:
- Star in bottom-right, linked to 4 orange, 3 green, and 2 purple nodes.
- Moderate density; 29 equations mirror Diagram L.
9. **Diagram k (40 eq.)**:
- Star in top-right, connected to 5 orange, 4 blue, and 3 purple nodes.
- High density; 40 equations indicate advanced complexity.
10. **Diagram m (45 eq.)**:
- Star in bottom-right, linked to 6 orange, 5 blue, and 4 green nodes.
- Very dense; 45 equations suggest near-maximum complexity.
11. **Diagram p (13 eq.)**:
- Star in bottom-center, connected to 3 orange and 2 purple nodes.
- Sparse connections; 13 equations imply low complexity.
12. **Diagram q (26 eq.)**:
- Star in top-center, linked to 4 orange, 3 green, and 2 blue nodes.
- Moderate density; 26 equations suggest mid-range complexity.
---
### Key Observations
- **Star Positioning**: The star node shifts from top-left (E, G) to bottom-right (q, m), possibly indicating evolving focal points.
- **Equation Count Correlation**: Higher equation counts (e.g., e: 53 eq.) correlate with denser networks and more node types.
- **Color Distribution**: Orange nodes dominate in high-complexity diagrams (e, c), while purple nodes appear only in simpler configurations (G, p).
- **Anomalies**: Diagram G (6 eq.) has the fewest nodes despite its central position, suggesting a minimalist model.
---
### Interpretation
The diagrams likely represent iterative network models, with equation counts reflecting parameters or constraints. The star node’s position may denote a central variable or input, while node colors differentiate roles (e.g., orange for inputs, blue for outputs). The progression from sparse (E, G) to dense (e, c) networks implies a scaling process, where increased equations enable more connections. The presence of purple nodes only in low-complexity diagrams (G, p) suggests they represent specialized or rare components. Overall, the visualization emphasizes how equation complexity shapes network topology, with the star node acting as a consistent anchor across configurations.