## Line Chart: Dimension vs. # GPU for Different Graph Sizes
### Overview
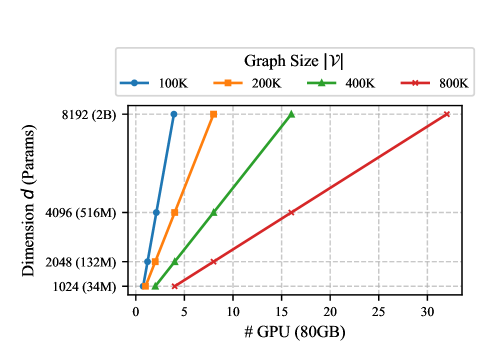
The image is a line chart that plots the relationship between the dimension *d* (number of parameters) and the number of GPUs (80GB each) required for different graph sizes. The graph sizes are 100K, 200K, 400K, and 800K. The chart shows how the dimension *d* increases with the number of GPUs for each graph size.
### Components/Axes
* **X-axis:** "# GPU (80GB)" - Represents the number of GPUs used, ranging from 0 to 30.
* **Y-axis:** "Dimension *d* (Params)" - Represents the dimension *d* in terms of the number of parameters, with values 1024 (34M), 2048 (132M), 4096 (516M), and 8192 (2B).
* **Legend (top):** "Graph Size |V|" - Indicates the different graph sizes represented by different colored lines:
* Blue: 100K
* Orange: 200K
* Green: 400K
* Red: 800K
### Detailed Analysis
* **Blue Line (100K):** This line represents the graph size of 100K. It starts at approximately 1024 (34M) dimension with 0 GPUs and increases sharply to 8192 (2B) dimension with approximately 4 GPUs.
* **Orange Line (200K):** This line represents the graph size of 200K. It starts at approximately 1024 (34M) dimension with 0 GPUs and increases sharply to 8192 (2B) dimension with approximately 7 GPUs.
* **Green Line (400K):** This line represents the graph size of 400K. It starts at approximately 1024 (34M) dimension with 0 GPUs and increases sharply to 8192 (2B) dimension with approximately 15 GPUs.
* **Red Line (800K):** This line represents the graph size of 800K. It starts at approximately 1024 (34M) dimension with 0 GPUs and increases linearly to 8192 (2B) dimension with approximately 32 GPUs.
### Key Observations
* All lines start at the same point on the y-axis, indicating that all graph sizes have the same initial dimension when no GPUs are used.
* The slopes of the lines vary, indicating that the dimension increases at different rates for different graph sizes as the number of GPUs increases.
* The red line (800K) has the shallowest slope, indicating that it requires the most GPUs to reach the maximum dimension.
* The blue line (100K) has the steepest slope, indicating that it requires the fewest GPUs to reach the maximum dimension.
### Interpretation
The chart demonstrates the relationship between graph size, dimension (number of parameters), and the number of GPUs required. It suggests that as the graph size increases, the number of GPUs required to achieve a certain dimension also increases. The different slopes of the lines indicate that the relationship is not linear and that larger graphs require a disproportionately larger number of GPUs to scale their dimensions. This information is crucial for resource allocation and optimization when working with large graphs in distributed computing environments.