## Line Chart: Dimension vs. GPU Count for Different Graph Sizes
### Overview
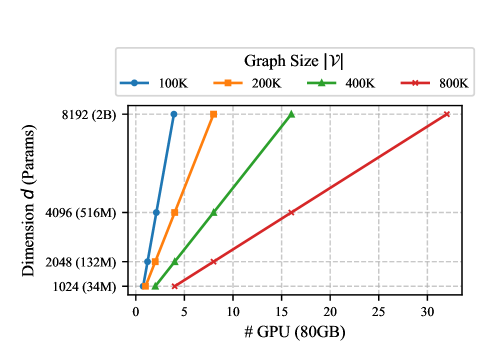
This line chart illustrates the relationship between the dimension *d* (in parameters) of a graph and the number of GPUs (each with 80GB of memory) required to process it, for four different graph sizes: 100K, 200K, 400K, and 800K. The chart shows how the required dimension increases with the number of GPUs for each graph size.
### Components/Axes
* **X-axis:** "# GPU (80GB)" - Number of GPUs, ranging from 0 to 30.
* **Y-axis:** "Dimension *d* (Params)" - Dimension in parameters, with a logarithmic scale. Marked values are 1024 (34M), 2048 (132M), 4096 (516M), and 8192 (2B).
* **Legend:** Located at the top-right of the chart.
* 100K (Blue Line)
* 200K (Orange Line)
* 400K (Green Line)
* 800K (Red Line)
* **Gridlines:** Present to aid in reading values.
### Detailed Analysis
The chart displays four distinct lines, each representing a different graph size.
* **100K (Blue Line):** This line shows a steep upward slope initially, then plateaus.
* At 0 GPUs, the dimension is approximately 1024 (34M).
* At 5 GPUs, the dimension is approximately 8192 (2B).
* The line remains relatively constant after 5 GPUs, hovering around 8192 (2B).
* **200K (Orange Line):** This line also exhibits a steep initial rise, but plateaus at a lower dimension than the 100K line.
* At 0 GPUs, the dimension is approximately 1024 (34M).
* At 5 GPUs, the dimension is approximately 8192 (2B).
* The line remains relatively constant after 5 GPUs, hovering around 8192 (2B).
* **400K (Green Line):** This line shows a more gradual upward slope compared to the 100K and 200K lines.
* At 0 GPUs, the dimension is approximately 1024 (34M).
* At 10 GPUs, the dimension is approximately 4096 (516M).
* At 15 GPUs, the dimension is approximately 8192 (2B).
* The line remains relatively constant after 15 GPUs, hovering around 8192 (2B).
* **800K (Red Line):** This line has the most gradual upward slope.
* At 0 GPUs, the dimension is approximately 1024 (34M).
* At 10 GPUs, the dimension is approximately 2048 (132M).
* At 20 GPUs, the dimension is approximately 4096 (516M).
* At 30 GPUs, the dimension is approximately 8192 (2B).
### Key Observations
* All graph sizes reach a maximum dimension of approximately 8192 (2B) parameters.
* Larger graph sizes require more GPUs to reach the same dimension.
* The relationship between GPU count and dimension appears to be non-linear, with diminishing returns as the number of GPUs increases.
* The 100K and 200K graph sizes saturate at a lower GPU count than the 400K and 800K graph sizes.
### Interpretation
The chart demonstrates the scalability of graph processing with respect to GPU resources. As the graph size increases, the required dimension (number of parameters) also increases, necessitating more GPUs to maintain performance. The plateauing of the lines suggests that there is a limit to the benefit of adding more GPUs beyond a certain point, likely due to memory constraints or communication overhead. The diminishing returns observed with larger graph sizes indicate that optimizing the graph structure or algorithm may be more effective than simply adding more GPUs. The data suggests that for graph sizes of 100K and 200K, 5 GPUs are sufficient to reach the maximum dimension, while larger graph sizes require significantly more GPUs. This information is crucial for resource allocation and system design when dealing with large-scale graph processing tasks.