# Technical Document Analysis: GPU Parameter Dimension vs Graph Size
## Chart Overview
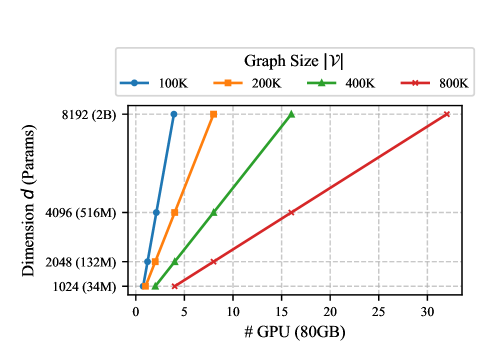
This line chart illustrates the relationship between the number of GPUs (each with 80GB memory) and the **dimension of parameters (d)** required to process graphs of varying sizes. The graph sizes are categorized as 100K, 200K, 400K, and 800K, represented by distinct colors and markers.
---
## Key Components
### Legend
- **Location**: Top-right corner.
- **Labels**:
- **Blue circle**: 100K graph size.
- **Orange square**: 200K graph size.
- **Green triangle**: 400K graph size.
- **Red cross**: 800K graph size.
### Axes
- **X-axis**: `# GPU (80GB)` (intervals: 0, 5, 10, 15, 20, 25, 30).
- **Y-axis**: `Dimension d (Params)` (labels: 1024 (34M), 2048 (132M), 4096 (516M), 8192 (2B)).
---
## Data Trends
### Line Analysis
1. **100K (Blue)**:
- **Trend**: Steepest slope.
- **Data Points**:
- (0 GPUs, 1024 params)
- (5 GPUs, 8192 params)
- **Observation**: Achieves 8192 params at 5 GPUs.
2. **200K (Orange)**:
- **Trend**: Moderate slope.
- **Data Points**:
- (0 GPUs, 1024 params)
- (5 GPUs, 2048 params)
- (10 GPUs, 4096 params)
- (15 GPUs, 8192 params)
- **Observation**: Requires 15 GPUs to reach 8192 params.
3. **400K (Green)**:
- **Trend**: Gradual slope.
- **Data Points**:
- (0 GPUs, 1024 params)
- (10 GPUs, 2048 params)
- (15 GPUs, 4096 params)
- (20 GPUs, 8192 params)
- **Observation**: Needs 20 GPUs for 8192 params.
4. **800K (Red)**:
- **Trend**: Flattest slope.
- **Data Points**:
- (0 GPUs, 1024 params)
- (15 GPUs, 2048 params)
- (20 GPUs, 4096 params)
- (25 GPUs, 8192 params)
- **Observation**: Requires 25 GPUs for 8192 params.
---
## Spatial Grounding
- **Legend Position**: Top-right (standard placement).
- **Data Point Colors**: Match legend entries exactly (e.g., blue circles for 100K).
---
## Data Table Reconstruction
| # GPUs | 100K (Params) | 200K (Params) | 400K (Params) | 800K (Params) |
|--------|---------------|---------------|---------------|---------------|
| 0 | 1024 | 1024 | 1024 | 1024 |
| 5 | 8192 | 2048 | - | - |
| 10 | - | 4096 | 2048 | - |
| 15 | - | 8192 | 4096 | 2048 |
| 20 | - | - | 8192 | 4096 |
| 25 | - | - | - | 8192 |
| 30 | - | - | - | - |
---
## Critical Observations
1. **Inverse Relationship**: Larger graph sizes (e.g., 800K) require significantly more GPUs to achieve the same parameter dimension compared to smaller graphs (e.g., 100K).
2. **Linear Scaling**: All lines are straight, indicating a linear relationship between GPU count and parameter dimension for fixed graph sizes.
3. **Resource Efficiency**: Smaller graphs (100K) are more parameter-efficient per GPU, while larger graphs (800K) demand disproportionately more hardware.
---
## Conclusion
The chart demonstrates that graph size directly impacts the computational resources (GPUs) required to handle parameter dimensions. Smaller graphs scale more efficiently, while larger graphs necessitate exponential increases in GPU allocation for comparable performance.