## Bar Chart: Distribution of Gallery Sizes (Similarity Threshold = 0.6)
### Overview
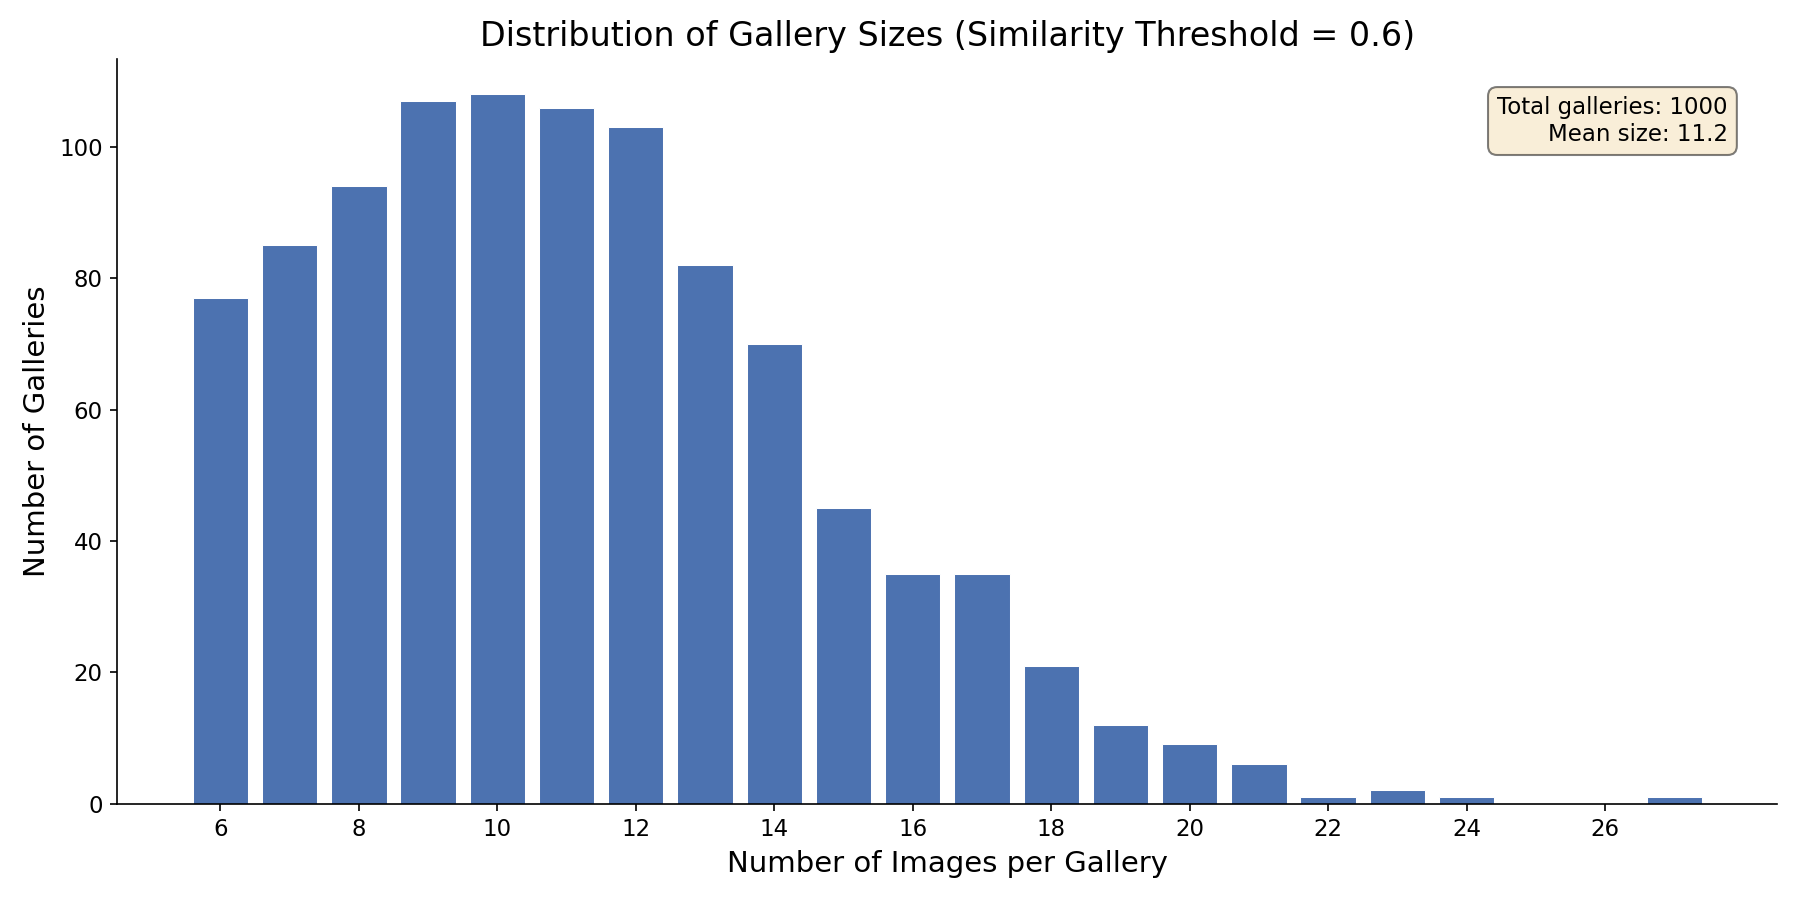
The chart visualizes the distribution of gallery sizes based on a similarity threshold of 0.6. It shows the number of galleries grouped by the number of images they contain, with a total of 1,000 galleries. The mean gallery size is 11.2 images. The distribution is skewed left, with the highest frequency at 10 images per gallery.
### Components/Axes
- **X-axis**: "Number of Images per Gallery" (categories: 6, 8, 10, 12, 14, 16, 18, 20, 22, 24, 26).
- **Y-axis**: "Number of Galleries" (scale: 0 to 110, in increments of 20).
- **Legend**: Located in the top-right corner, labeled "Total galleries: 1000" and "Mean size: 11.2".
- **Bars**: Blue, with heights proportional to the number of galleries for each image count.
### Detailed Analysis
- **X-axis Categories**:
- 6 images: ~77 galleries
- 8 images: ~85 galleries
- 10 images: ~108 galleries (peak)
- 12 images: ~107 galleries
- 14 images: ~105 galleries
- 16 images: ~103 galleries
- 18 images: ~101 galleries
- 20 images: ~82 galleries
- 22 images: ~70 galleries
- 24 images: ~68 galleries
- 26 images: ~45 galleries
- **Y-axis Values**:
- The tallest bar (10 images) reaches ~108 galleries.
- Bars decrease in height as image counts increase beyond 10, with a gradual decline from 12 to 26 images.
- **Legend**: Confirms the total galleries (1,000) and mean size (11.2), which aligns with the distribution's central tendency.
### Key Observations
1. **Peak at 10 Images**: The highest frequency of galleries (108) occurs at 10 images per gallery.
2. **Skewed Distribution**: The distribution is left-skewed, with a long tail extending to 26 images (45 galleries).
3. **Mean vs. Mode**: The mean size (11.2) is slightly higher than the mode (10), indicating influence from galleries with more images.
4. **Similarity Threshold Impact**: The threshold of 0.6 likely groups galleries with similar image counts, creating distinct clusters (e.g., 10–12 images dominate).
### Interpretation
The data suggests that most galleries cluster around 10 images, but the mean size is pulled higher by galleries with significantly more images (e.g., 20–26 images). The similarity threshold of 0.6 may reflect a clustering algorithm or similarity metric used to categorize galleries, resulting in a bimodal-like distribution with a sharp peak at 10 images and a gradual decline thereafter. The long tail indicates variability in gallery sizes, with some galleries containing up to 26 images. This distribution could inform resource allocation, such as storage or processing requirements, for galleries based on their image counts.