## Bar Chart: Qwen2.5-14B-Instruct Model Performance Across Datasets
### Overview
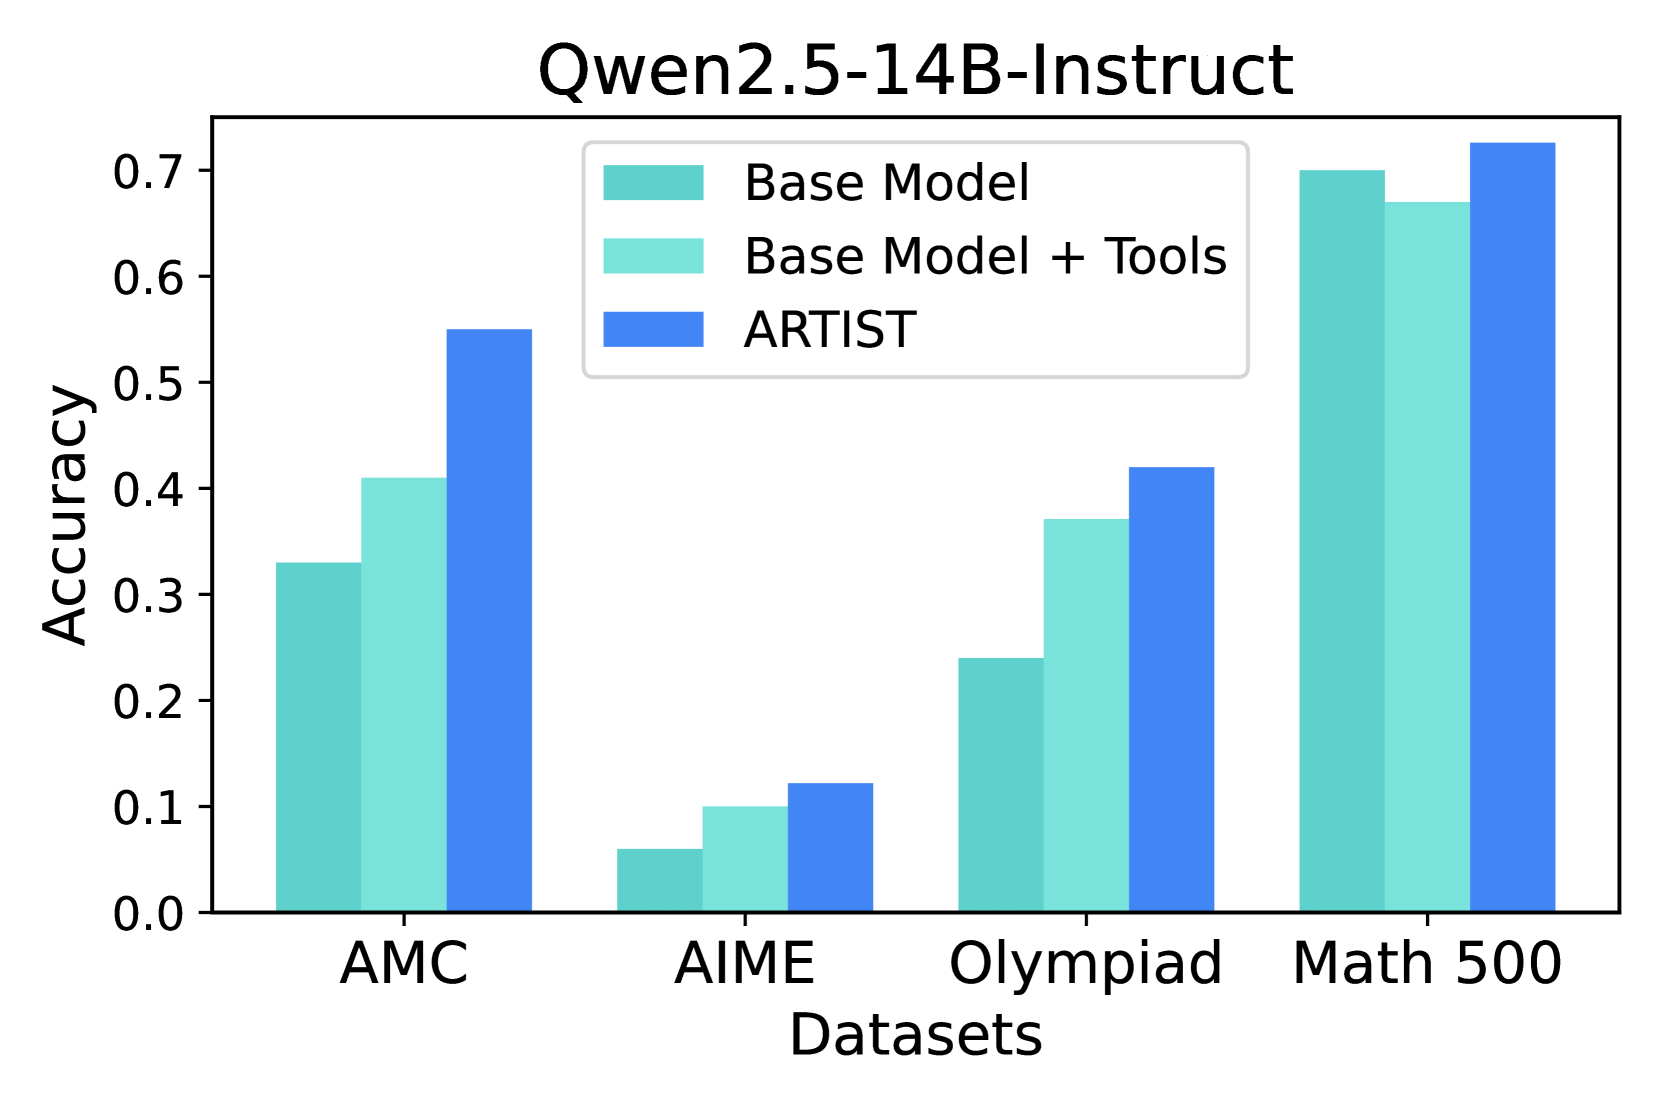
The chart compares the accuracy of three model configurations (Base Model, Base Model + Tools, ARTIST) across four datasets (AMC, AIME, Olympiad, Math 500). Accuracy values range from 0.0 to 0.7 on the y-axis, with datasets listed on the x-axis.
### Components/Axes
- **X-axis (Datasets)**: AMC, AIME, Olympiad, Math 500 (left to right)
- **Y-axis (Accuracy)**: 0.0 to 0.7 in increments of 0.1
- **Legend**:
- Dark teal: Base Model
- Light teal: Base Model + Tools
- Blue: ARTIST
- **Title**: "Qwen2.5-14B-Instruct" (top center)
### Detailed Analysis
1. **AMC Dataset**:
- Base Model: ~0.33
- Base Model + Tools: ~0.41
- ARTIST: ~0.55
2. **AIME Dataset**:
- Base Model: ~0.06
- Base Model + Tools: ~0.10
- ARTIST: ~0.12
3. **Olympiad Dataset**:
- Base Model: ~0.24
- Base Model + Tools: ~0.37
- ARTIST: ~0.42
4. **Math 500 Dataset**:
- Base Model: ~0.70
- Base Model + Tools: ~0.67
- ARTIST: ~0.73
### Key Observations
- **ARTIST** consistently outperforms both Base Model and Base Model + Tools across all datasets.
- **Math 500** shows the highest accuracy for all configurations, while **AIME** has the lowest.
- The gap between Base Model and ARTIST is largest in AMC (~0.22) and smallest in Math 500 (~0.03).
- Base Model + Tools improves over Base Model but remains inferior to ARTIST in all cases.
### Interpretation
The data demonstrates that the ARTIST configuration significantly enhances model performance compared to the base model and tool-augmented version. This suggests ARTIST incorporates critical architectural or training improvements. Math 500's high accuracy across all configurations indicates it is the easiest dataset, while AIME's low performance highlights its complexity. The smaller performance gap in Math 500 implies that even basic models can achieve near-optimal results on simpler tasks, whereas complex datasets like AIME require advanced configurations like ARTIST to approach peak performance. The tools provide marginal benefits (~0.03-0.05 improvement over Base Model), suggesting they may not fully address the model's limitations in complex reasoning tasks.