## Bar Chart: Qwen2.5-14B-Instruct
### Overview
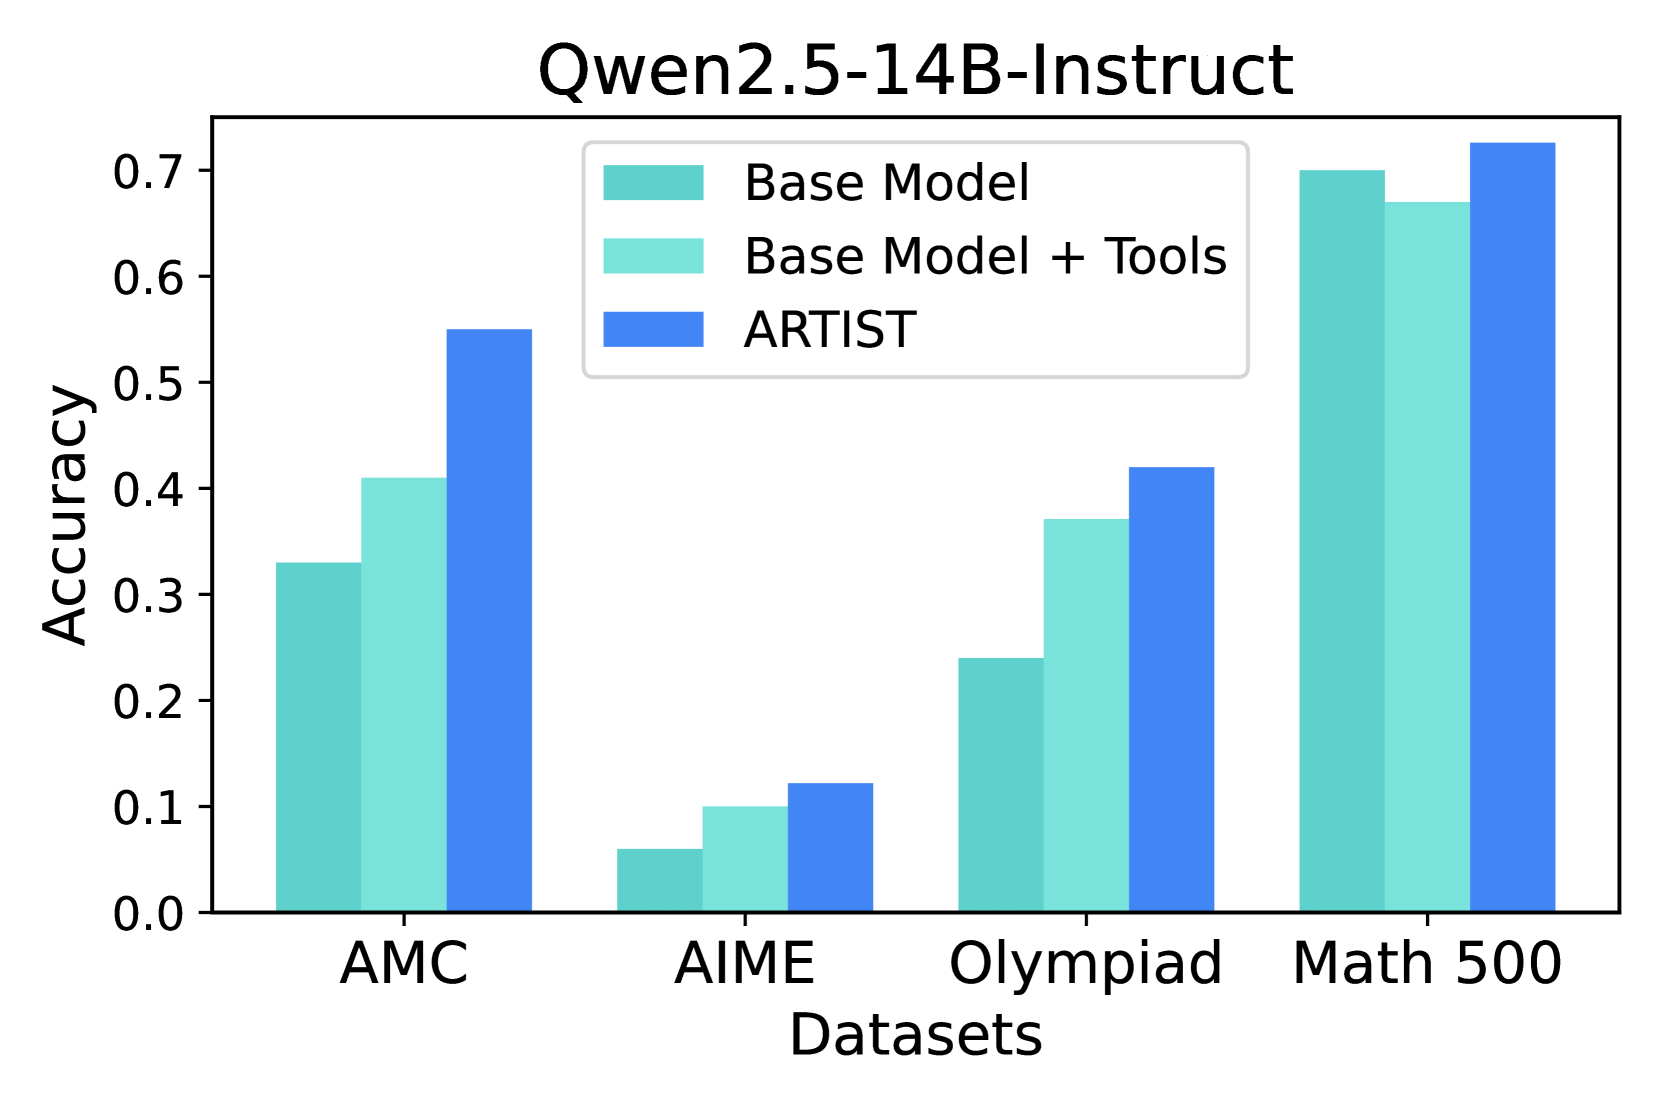
The image is a bar chart comparing the accuracy of three models (Base Model, Base Model + Tools, and ARTIST) across four datasets (AMC, AIME, Olympiad, and Math 500). The y-axis represents accuracy, ranging from 0.0 to 0.7. The x-axis represents the datasets.
### Components/Axes
* **Title:** Qwen2.5-14B-Instruct
* **X-axis:** Datasets (AMC, AIME, Olympiad, Math 500)
* **Y-axis:** Accuracy (ranging from 0.0 to 0.7, with increments of 0.1)
* **Legend:** Located at the top-right of the chart.
* Base Model (Turquoise)
* Base Model + Tools (Light Turquoise)
* ARTIST (Blue)
### Detailed Analysis
Here's a breakdown of the accuracy for each model on each dataset:
* **AMC:**
* Base Model: ~0.33
* Base Model + Tools: ~0.41
* ARTIST: ~0.55
* **AIME:**
* Base Model: ~0.06
* Base Model + Tools: ~0.10
* ARTIST: ~0.12
* **Olympiad:**
* Base Model: ~0.24
* Base Model + Tools: ~0.37
* ARTIST: ~0.42
* **Math 500:**
* Base Model: ~0.70
* Base Model + Tools: ~0.67
* ARTIST: ~0.72
### Key Observations
* The ARTIST model consistently outperforms the Base Model and Base Model + Tools across all datasets.
* The Math 500 dataset shows the highest accuracy for all models.
* The AIME dataset shows the lowest accuracy for all models.
* The "Base Model + Tools" generally performs slightly better than the "Base Model" alone.
### Interpretation
The bar chart demonstrates the performance of different models on various datasets. The ARTIST model shows a clear advantage in accuracy compared to the base models, suggesting that the ARTIST model architecture or training process is more effective for these tasks. The Math 500 dataset appears to be the easiest for these models, while the AIME dataset is the most challenging. The addition of tools to the base model provides a marginal improvement in accuracy.