\n
## Diagram: 2D and 3D Polyhedral Network
### Overview
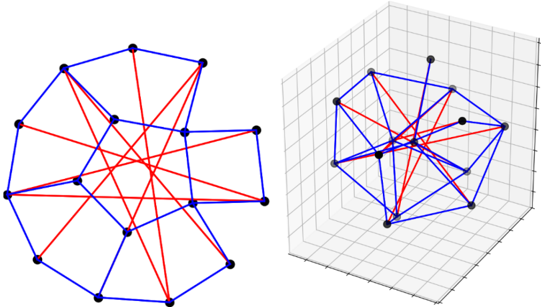
The image presents two views of the same interconnected network of points. The left image shows a 2D projection of the network, while the right image displays a 3D representation within a cubic grid. The network consists of nodes connected by lines, with lines colored either red or blue. There are no axis labels or numerical data present.
### Components/Axes
The image lacks explicit axes or labels. The components are:
* **Nodes:** Black dots representing vertices.
* **Edges:** Lines connecting the nodes, colored red or blue.
* **2D Projection:** A flat representation of the network.
* **3D Representation:** A perspective view of the network within a cubic grid.
* **Cubic Grid:** Light gray lines forming a cube in the 3D view, providing spatial context.
### Detailed Analysis or Content Details
The 2D projection (left) appears to be a polygon with approximately 16 vertices. The lines connecting these vertices form a complex network of triangles and quadrilaterals. The lines are colored red and blue, seemingly randomly distributed.
The 3D representation (right) shows a similar network embedded in a 3D space. The network appears to be a polyhedron with approximately 12 vertices. The lines connecting the vertices are again colored red and blue. The perspective view makes it difficult to precisely count the number of edges and faces.
The 2D projection has approximately 30 edges, while the 3D representation has approximately 25 visible edges. The distribution of red and blue lines appears roughly equal in both views.
There is no quantitative data associated with the nodes or edges. The image focuses on the connectivity and spatial arrangement of the network.
### Key Observations
* The network is highly interconnected, with each node connected to multiple other nodes.
* The color of the edges (red and blue) does not seem to follow a clear pattern or represent any specific attribute.
* The 3D representation provides a better sense of the network's spatial complexity.
* The image is purely visual and lacks any numerical data or labels.
### Interpretation
The image likely represents a graph or network structure. The red and blue lines could represent different types of connections or relationships between the nodes. The 2D and 3D views provide different perspectives on the same network, allowing for a better understanding of its overall structure and connectivity.
Without additional information, it is difficult to determine the specific meaning or purpose of this network. It could represent a variety of things, such as a social network, a communication network, or a physical system. The lack of labels or data makes it impossible to draw any definitive conclusions.
The image serves as a visual representation of a complex network, highlighting its interconnectedness and spatial arrangement. It could be used to illustrate concepts in graph theory, network science, or computational geometry. The image is a demonstration of a network, and does not provide any facts or data.