## Diagram Type: Vector Diagram
### Overview
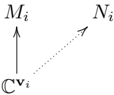
The image depicts a vector diagram with two main components: a solid arrow and a dotted arrow. The solid arrow is labeled with "M_i" and points upwards, while the dotted arrow is labeled with "N_i" and points to the right. The diagram also includes a point labeled "C_i" at the intersection of the two arrows.
### Components/Axes
- **M_i**: Solid arrow pointing upwards
- **N_i**: Dotted arrow pointing to the right
- **C_i**: Point at the intersection of the two arrows
### Detailed Analysis or ### Content Details
The diagram shows a relationship between the two arrows, with "M_i" representing a quantity that is increasing or growing, and "N_i" representing a quantity that is decreasing or shrinking. The point "C_i" represents the intersection of the two arrows, which could represent a balance or equilibrium between the two quantities.
### Key Observations
The diagram suggests that there is a dynamic relationship between the two quantities, with one increasing and the other decreasing. The intersection point "C_i" could represent a point of balance or equilibrium between the two quantities.
### Interpretation
The diagram could be used to represent a variety of concepts, such as the relationship between two variables in a scientific or mathematical context. The solid arrow could represent a positive change or growth, while the dotted arrow could represent a negative change or decline. The intersection point "C_i" could represent a point of balance or equilibrium between the two variables. The diagram could also be used to represent a relationship between two variables in a social or economic context, where one variable is increasing and the other is decreasing.