## Line Chart: Relative Success Rate vs. Number of Queries
### Overview
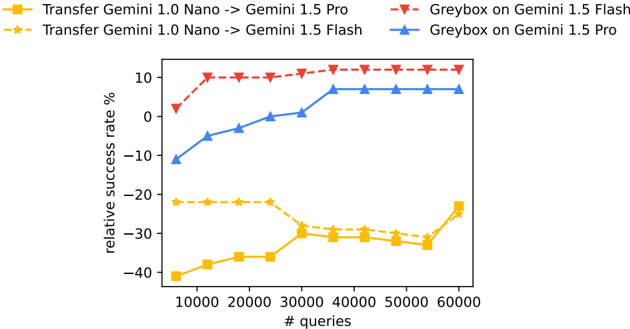
The image is a line chart comparing the relative success rates of different transfer methods and greybox methods on Gemini models, plotted against the number of queries. The chart displays four data series, each representing a different combination of transfer/greybox method and Gemini model.
### Components/Axes
* **X-axis:** "# queries" - Number of queries, ranging from 0 to 60000, with tick marks at 10000, 20000, 30000, 40000, 50000, and 60000.
* **Y-axis:** "relative success rate %" - Relative success rate in percentage, ranging from -40% to 10%, with tick marks at -40, -30, -20, -10, 0, and 10.
* **Legend (Top-Left):**
* Yellow solid line with square markers: "Transfer Gemini 1.0 Nano -> Gemini 1.5 Pro"
* Yellow dashed line with star markers: "Transfer Gemini 1.0 Nano -> Gemini 1.5 Flash"
* Red dashed line with triangle markers: "Greybox on Gemini 1.5 Flash"
* Blue solid line with triangle markers: "Greybox on Gemini 1.5 Pro"
### Detailed Analysis
* **Transfer Gemini 1.0 Nano -> Gemini 1.5 Pro (Yellow solid line):** The line starts at approximately -41% at 10000 queries, increases to approximately -35% at 20000 queries, then to -30% at 30000 queries, then to -29% at 40000 queries, then to -32% at 50000 queries, and ends at approximately -24% at 60000 queries.
* **Transfer Gemini 1.0 Nano -> Gemini 1.5 Flash (Yellow dashed line):** The line starts at approximately -22% at 10000 queries, remains relatively constant at approximately -22% until 30000 queries, then decreases to approximately -30% at 40000 queries, then to -32% at 50000 queries, and ends at approximately -24% at 60000 queries.
* **Greybox on Gemini 1.5 Flash (Red dashed line):** The line starts at approximately 2% at 10000 queries, increases to approximately 10% at 20000 queries, and then remains relatively constant at approximately 12% until 60000 queries.
* **Greybox on Gemini 1.5 Pro (Blue solid line):** The line starts at approximately -12% at 10000 queries, increases to approximately -4% at 20000 queries, then to 0% at 30000 queries, then to 7% at 40000 queries, and then remains relatively constant at approximately 7% until 60000 queries.
### Key Observations
* The "Greybox on Gemini 1.5 Flash" method consistently shows the highest relative success rate across all query numbers.
* The "Transfer Gemini 1.0 Nano -> Gemini 1.5 Pro" method shows the lowest relative success rate across all query numbers.
* The relative success rates for "Greybox on Gemini 1.5 Flash" and "Greybox on Gemini 1.5 Pro" increase significantly in the initial phase (up to 40000 queries) and then plateau.
* The relative success rates for "Transfer Gemini 1.0 Nano -> Gemini 1.5 Pro" and "Transfer Gemini 1.0 Nano -> Gemini 1.5 Flash" are negative across all query numbers.
### Interpretation
The chart compares the performance of different methods (transfer learning vs. greybox) when applied to different Gemini models. The "Greybox on Gemini 1.5 Flash" method appears to be the most effective, consistently achieving the highest relative success rate. The transfer learning methods, particularly "Transfer Gemini 1.0 Nano -> Gemini 1.5 Pro", show significantly lower success rates, suggesting that they may not be as effective in this context. The initial increase in success rates for the greybox methods suggests that they benefit from more queries, but their performance plateaus after a certain point. The negative success rates for the transfer learning methods indicate that they may be detrimental to performance compared to a baseline.