\n
## Line Chart: Relative Success Rate vs. Number of Queries
### Overview
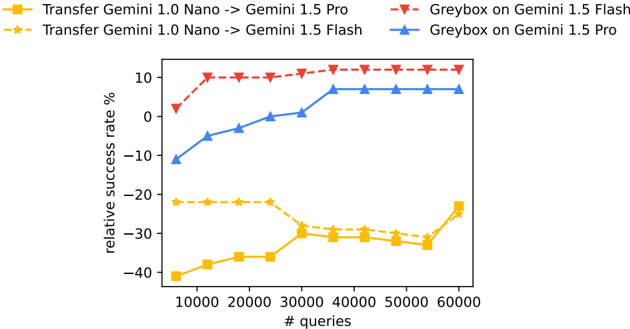
This line chart compares the relative success rates of two model transfer scenarios – Transfer Gemini 1.0 Nano -> Gemini 1.5 Pro and Transfer Gemini 1.0 Nano -> Gemini 1.5 Flash – against Greybox on Gemini 1.5 Flash and Greybox on Gemini 1.5 Pro, as the number of queries increases. The y-axis represents the relative success rate in percentage, while the x-axis represents the number of queries.
### Components/Axes
* **X-axis:** "# queries" with markers at 10000, 20000, 30000, 40000, 50000, and 60000.
* **Y-axis:** "relative success rate %" ranging from approximately -40% to +10%.
* **Legend:** Located at the top of the chart, containing the following labels and corresponding colors:
* Yellow: Transfer Gemini 1.0 Nano -> Gemini 1.5 Pro
* Orange: Transfer Gemini 1.0 Nano -> Gemini 1.5 Flash
* Red: Greybox on Gemini 1.5 Flash
* Blue: Greybox on Gemini 1.5 Pro
### Detailed Analysis
* **Transfer Gemini 1.0 Nano -> Gemini 1.5 Pro (Yellow Line):** This line starts at approximately -40% at 10000 queries and exhibits an upward trend, reaching approximately -25% at 60000 queries. The slope is positive but decreasing.
* 10000 queries: -40%
* 20000 queries: -35%
* 30000 queries: -30%
* 40000 queries: -28%
* 50000 queries: -28%
* 60000 queries: -25%
* **Transfer Gemini 1.0 Nano -> Gemini 1.5 Flash (Orange Line):** This line begins at approximately -20% at 10000 queries, initially increasing to around -15% at 20000 queries, then decreasing to approximately -30% at 50000 queries, and finally rising slightly to around -28% at 60000 queries. The trend is relatively flat with some fluctuations.
* 10000 queries: -20%
* 20000 queries: -15%
* 30000 queries: -20%
* 40000 queries: -25%
* 50000 queries: -30%
* 60000 queries: -28%
* **Greybox on Gemini 1.5 Flash (Red Line):** This line shows a relatively stable and high success rate, starting at approximately 5% at 10000 queries and increasing to around 10% at 20000 queries, remaining relatively constant around 8-10% for the rest of the query range.
* 10000 queries: 5%
* 20000 queries: 10%
* 30000 queries: 10%
* 40000 queries: 9%
* 50000 queries: 9%
* 60000 queries: 10%
* **Greybox on Gemini 1.5 Pro (Blue Line):** This line starts at approximately -10% at 10000 queries and increases steadily to around 5% at 40000 queries, then plateaus around 5-7% for the remaining query range.
* 10000 queries: -10%
* 20000 queries: 0%
* 30000 queries: 3%
* 40000 queries: 5%
* 50000 queries: 6%
* 60000 queries: 5%
### Key Observations
* The "Greybox on Gemini 1.5 Flash" consistently demonstrates the highest relative success rate across all query numbers.
* Both transfer learning scenarios ("Transfer Gemini 1.0 Nano -> Gemini 1.5 Pro" and "Transfer Gemini 1.0 Nano -> Gemini 1.5 Flash") start with negative relative success rates, indicating they initially perform worse than the Greybox models.
* The "Transfer Gemini 1.0 Nano -> Gemini 1.5 Pro" shows a consistent, albeit slow, improvement in relative success rate as the number of queries increases.
* The "Transfer Gemini 1.0 Nano -> Gemini 1.5 Flash" exhibits a more volatile trend, with initial improvement followed by a decline and a slight recovery.
### Interpretation
The data suggests that using a Greybox approach with either Gemini 1.5 Flash or Gemini 1.5 Pro yields better initial performance than transferring knowledge from Gemini 1.0 Nano. However, the transfer learning approach with Gemini 1.5 Pro shows a positive trend, indicating that with more queries, its performance gradually improves and may eventually approach or surpass the Greybox models. The fluctuating performance of the transfer learning with Gemini 1.5 Flash suggests that it may be more sensitive to the specific characteristics of the queries or require a different training strategy. The negative relative success rates for the transfer learning scenarios at the beginning indicate a potential need for further fine-tuning or adaptation of the transferred model. The chart highlights the trade-off between initial performance and potential for improvement when considering different model transfer strategies. The consistent high performance of the Greybox models suggests they are robust and well-suited for a wide range of queries, while the transfer learning models may require more data and optimization to achieve comparable results.