\n
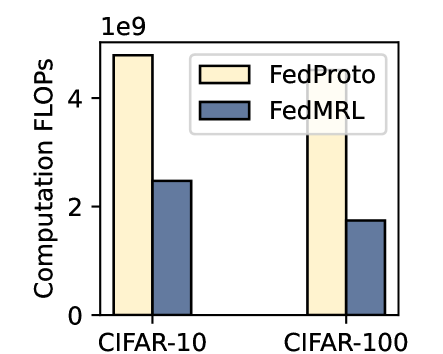
## Bar Chart: Computation FLOPs Comparison
### Overview
This bar chart compares the computational FLOPs (Floating Point Operations Per Second) required by two methods, FedProto and FedMRL, on two datasets: CIFAR-10 and CIFAR-100. The chart uses paired bars for each dataset to represent the FLOPs for each method.
### Components/Axes
* **X-axis:** Datasets - CIFAR-10 and CIFAR-100.
* **Y-axis:** Computation FLOPs, scaled from 0 to 1e9 (1 billion).
* **Legend:**
* FedProto (represented by a light yellow color)
* FedMRL (represented by a dark blue color)
* **Chart Title:** Not explicitly present, but the chart's purpose is clear from the axes and legend.
### Detailed Analysis
The chart consists of two pairs of bars, one for each dataset.
**CIFAR-10:**
* **FedProto:** The bar for FedProto on CIFAR-10 reaches approximately 4.8e9 FLOPs. The bar is light yellow, matching the legend.
* **FedMRL:** The bar for FedMRL on CIFAR-10 reaches approximately 2.5e9 FLOPs. The bar is dark blue, matching the legend.
**CIFAR-100:**
* **FedProto:** The bar for FedProto on CIFAR-100 reaches approximately 3.5e9 FLOPs. The bar is light yellow, matching the legend.
* **FedMRL:** The bar for FedMRL on CIFAR-100 reaches approximately 1.7e9 FLOPs. The bar is dark blue, matching the legend.
### Key Observations
* FedProto consistently requires more FLOPs than FedMRL for both datasets.
* The difference in FLOPs between the two methods is more pronounced on the CIFAR-10 dataset than on the CIFAR-100 dataset.
* The FLOPs required for both methods are higher on CIFAR-10 than on CIFAR-100.
### Interpretation
The data suggests that FedProto is computationally more expensive than FedMRL. This could be due to differences in the algorithms or the complexity of the models used by each method. The higher computational cost on CIFAR-10 might be related to the smaller number of classes in the dataset, potentially leading to more complex model interactions. The chart highlights a trade-off between computational efficiency and potentially other factors like model accuracy or convergence speed, which are not directly represented in this chart. The data suggests that if computational resources are limited, FedMRL might be a more suitable choice, while if computational resources are abundant, FedProto could be considered. Further investigation would be needed to understand the reasons behind these differences and to determine the optimal method for a given application.