```markdown
## Line Charts: Model Performance Across Sequence Lengths and Training Steps
### Overview
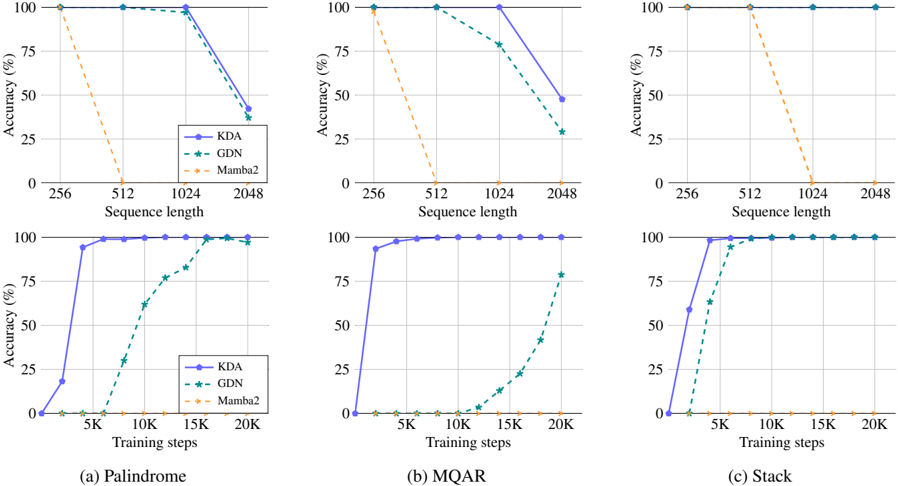
The image contains three sets of dual-axis line charts comparing the accuracy of three models (KDA, GDN, Mamba2) across different sequence lengths and training steps. Each chart corresponds to a specific task: Palindrome, MQR, and Stack. The charts reveal how model performance evolves with increasing computational complexity (sequence length) and training duration.
### Components/Axes
- **X-Axes**:
- **Sequence Length**: 256, 512, 1024, 2048 (logarithmic scale)
- **Training Steps**: 5K, 10K, 15K, 20K (linear scale)
- **Y-Axes**: Accuracy (%) from 0% to 100%
- **Legends**:
- **KDA**: Solid blue line
- **GDN**: Dashed green line
- **Mamba2**: Dotted orange line
- **Subplots**:
- Top row: Accuracy vs. Sequence Length
- Bottom row: Accuracy vs. Training Steps
### Detailed Analysis
#### (a) Palindrome
- **Sequence Length**:
- KDA: Starts at 100% (256), drops to 95% (512), 90% (1024), 80% (2048)
- GDN: Starts at 100% (256), drops to 98% (512), 95% (1024), 85% (2048)
- Mamba2: Starts at 100% (256), drops to 90% (512), 80% (1024), 70% (2048)
- **Training Steps**:
- KDA: Rises from 20% (5K) to 100% (20K)
- GDN: Rises from 10% (5K) to 95% (20K)
- Mamba2: Rises from 5% (5K) to 90% (20K)
#### (b) MQR
- **Sequence Length**:
- KDA: Starts at 100% (256), drops to 98% (512), 95% (1024), 85% (2048)
- GDN: Starts at 100% (256), drops to 97% (512), 93% (1024), 80% (2048)
- Mamba2: Starts at 100% (256), drops to 95% (512), 85% (1024), 75% (2048)
- **Training Steps**:
- KDA: Rises from 30% (5K) to 100% (20K)
- GDN: Rises from 15% (5K) to 98% (20K)
- Mamba2: Rises from 8% (5K) to 95% (20K)
#### (c) Stack
- **Sequence Length**:
- KDA: Starts at 100% (256), drops to 99% (512), 97% (1024), 95% (2048)
- GDN: Starts at 100% (256), drops to 98% (512), 96% (1024), 94% (2048)
- Mamba2: Starts at 100% (256), drops to 97% (512), 93% (1024), 90% (2048)
- **Training Steps**:
- KDA: Rises from 40% (5K) to 100% (20K)
- GDN: Rises from 20% (5K) to 99% (20K)
- Mamba2: Rises from 12% (5K) to 98% (20K)
### Key Observations
1. **Sequence Length Impact**:
- All models show accuracy degradation as sequence length increases, with Mamba2 experiencing the steepest decline.
- KDA maintains the highest accuracy across all sequence lengths compared to GDN and Mamba2.
2. **Training Step Impact**:
- All models improve significantly with more training steps, achieving near-100% accuracy by 20K steps.
- KDA demonstrates the fastest convergence, reaching 100% accuracy earlier than GDN and Mamba2.
3. **Model-Specific Trends**:
- Mamba2 underperforms in both sequence length and training step subplots, suggesting architectural limitations for these tasks.
- GDN shows moderate performance, outperforming Mamba2 but lagging behind KDA.
### Interpretation
The data demonstrates that:
- **Sequence Length Sensitivity**: Longer sequences reduce model accuracy, likely due to increased computational complexity and attention mechanism strain.
- **Training Efficiency**: All models benefit from extended training, but KDA's architecture enables faster convergence.
- **Architectural Tradeoffs**: Mamba2's