# Technical Document Extraction: Latent Space Analysis Chart
## 1. Chart Components and Labels
### Axes
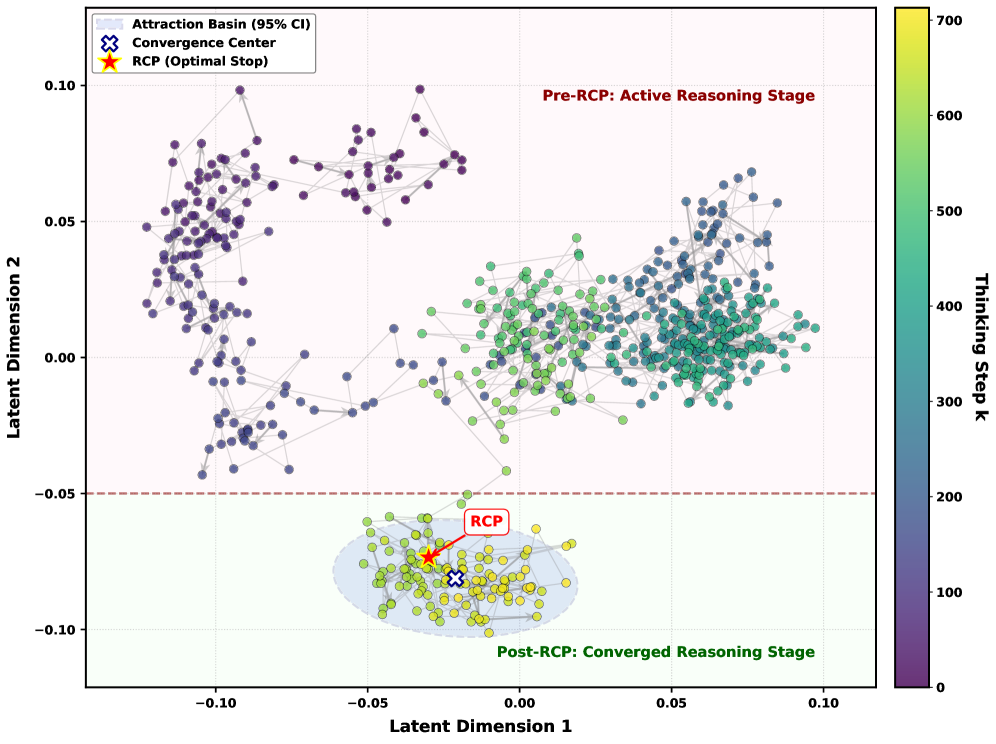
- **X-axis**: Latent Dimension 1 (ranging from -0.10 to 0.10)
- **Y-axis**: Latent Dimension 2 (ranging from -0.10 to 0.10)
### Legend (Top Left)
- **Attraction Basin (95% CI)**: Light blue shaded region
- **Convergence Center**: Dark blue "X" marker
- **RCP (Optimal Stop)**: Red star marker
### Colorbar (Right Side)
- **Title**: Thinking Step k
- **Range**: 0 (purple) to 700 (yellow)
- **Gradient**: Purple → Blue → Green → Yellow
## 2. Annotations and Textual Elements
- **Pre-RCP: Active Reasoning Stage** (Red text, top right quadrant)
- **Post-RCP: Converged Reasoning Stage** (Green text, bottom right quadrant)
- **RCP** (Red star, annotated with arrow pointing to cluster center)
- **Convergence Center** (Dark blue "X", annotated with arrow pointing to cluster center)
## 3. Spatial Grounding of Legend
- **Legend Position**: Top-left corner (coordinates: [0.02, 0.98] relative to chart bounds)
- **Color Consistency Check**:
- Attraction Basin: Light blue matches shaded region
- Convergence Center: Dark blue "X" matches cluster center
- RCP: Red star matches optimal stop marker
## 4. Data Trends and Visual Patterns
### Pre-RCP Region (Top Left)
- **Data Points**: Purple and blue dots (Thinking Step k: 0–300)
- **Distribution**: Scattered, forming loose clusters
- **Trend**: No clear convergence; points spread across Latent Dimensions 1 and 2
### Post-RCP Region (Bottom Right)
- **Data Points**: Green and yellow dots (Thinking Step k: 300–700)
- **Distribution**: Dense cluster around RCP (red star)
- **Trend**: Strong convergence toward RCP; points tightly grouped near [0.0, -0.05]
### Convergence Center
- **Location**: Near RCP (coordinates: [0.0, -0.05])
- **Visual Confirmation**: Dark blue "X" aligns with cluster center of Post-RCP data
## 5. Structural Analysis
### Regions of Interest
1. **Pre-RCP Active Reasoning Stage**:
- Latent Dimensions: -0.10 < x < 0.10, 0.0 < y < 0.10
- Key Feature: Dispersed data points with no dominant cluster
2. **Post-RCP Converged Reasoning Stage**:
- Latent Dimensions: -0.05 < x < 0.10, -0.10 < y < 0.0
- Key Feature: High-density cluster around RCP
### Color-Coded Thinking Steps
- **Low k (0–300)**: Purple/blue points (Pre-RCP)
- **High k (300–700)**: Green/yellow points (Post-RCP)
## 6. Missing Elements
- **Data Table**: Not present in the chart
- **Additional Text**: No non-English text detected
## 7. Summary of Key Findings
1. **Pre-RCP Stage**: Active reasoning with dispersed latent space exploration
2. **Post-RCP Stage**: Converged reasoning with optimal stop (RCP) at [0.0, -0.05]
3. **Convergence Mechanism**: Attraction Basin (light blue) guides data toward Convergence Center (dark blue "X")
4. **Optimal Stop**: RCP (red star) represents the most efficient reasoning endpoint
This extraction provides a complete technical description of the chart, enabling reconstruction of the visualization without the original image.