## Bar Chart: Activation Rate Comparison
### Overview
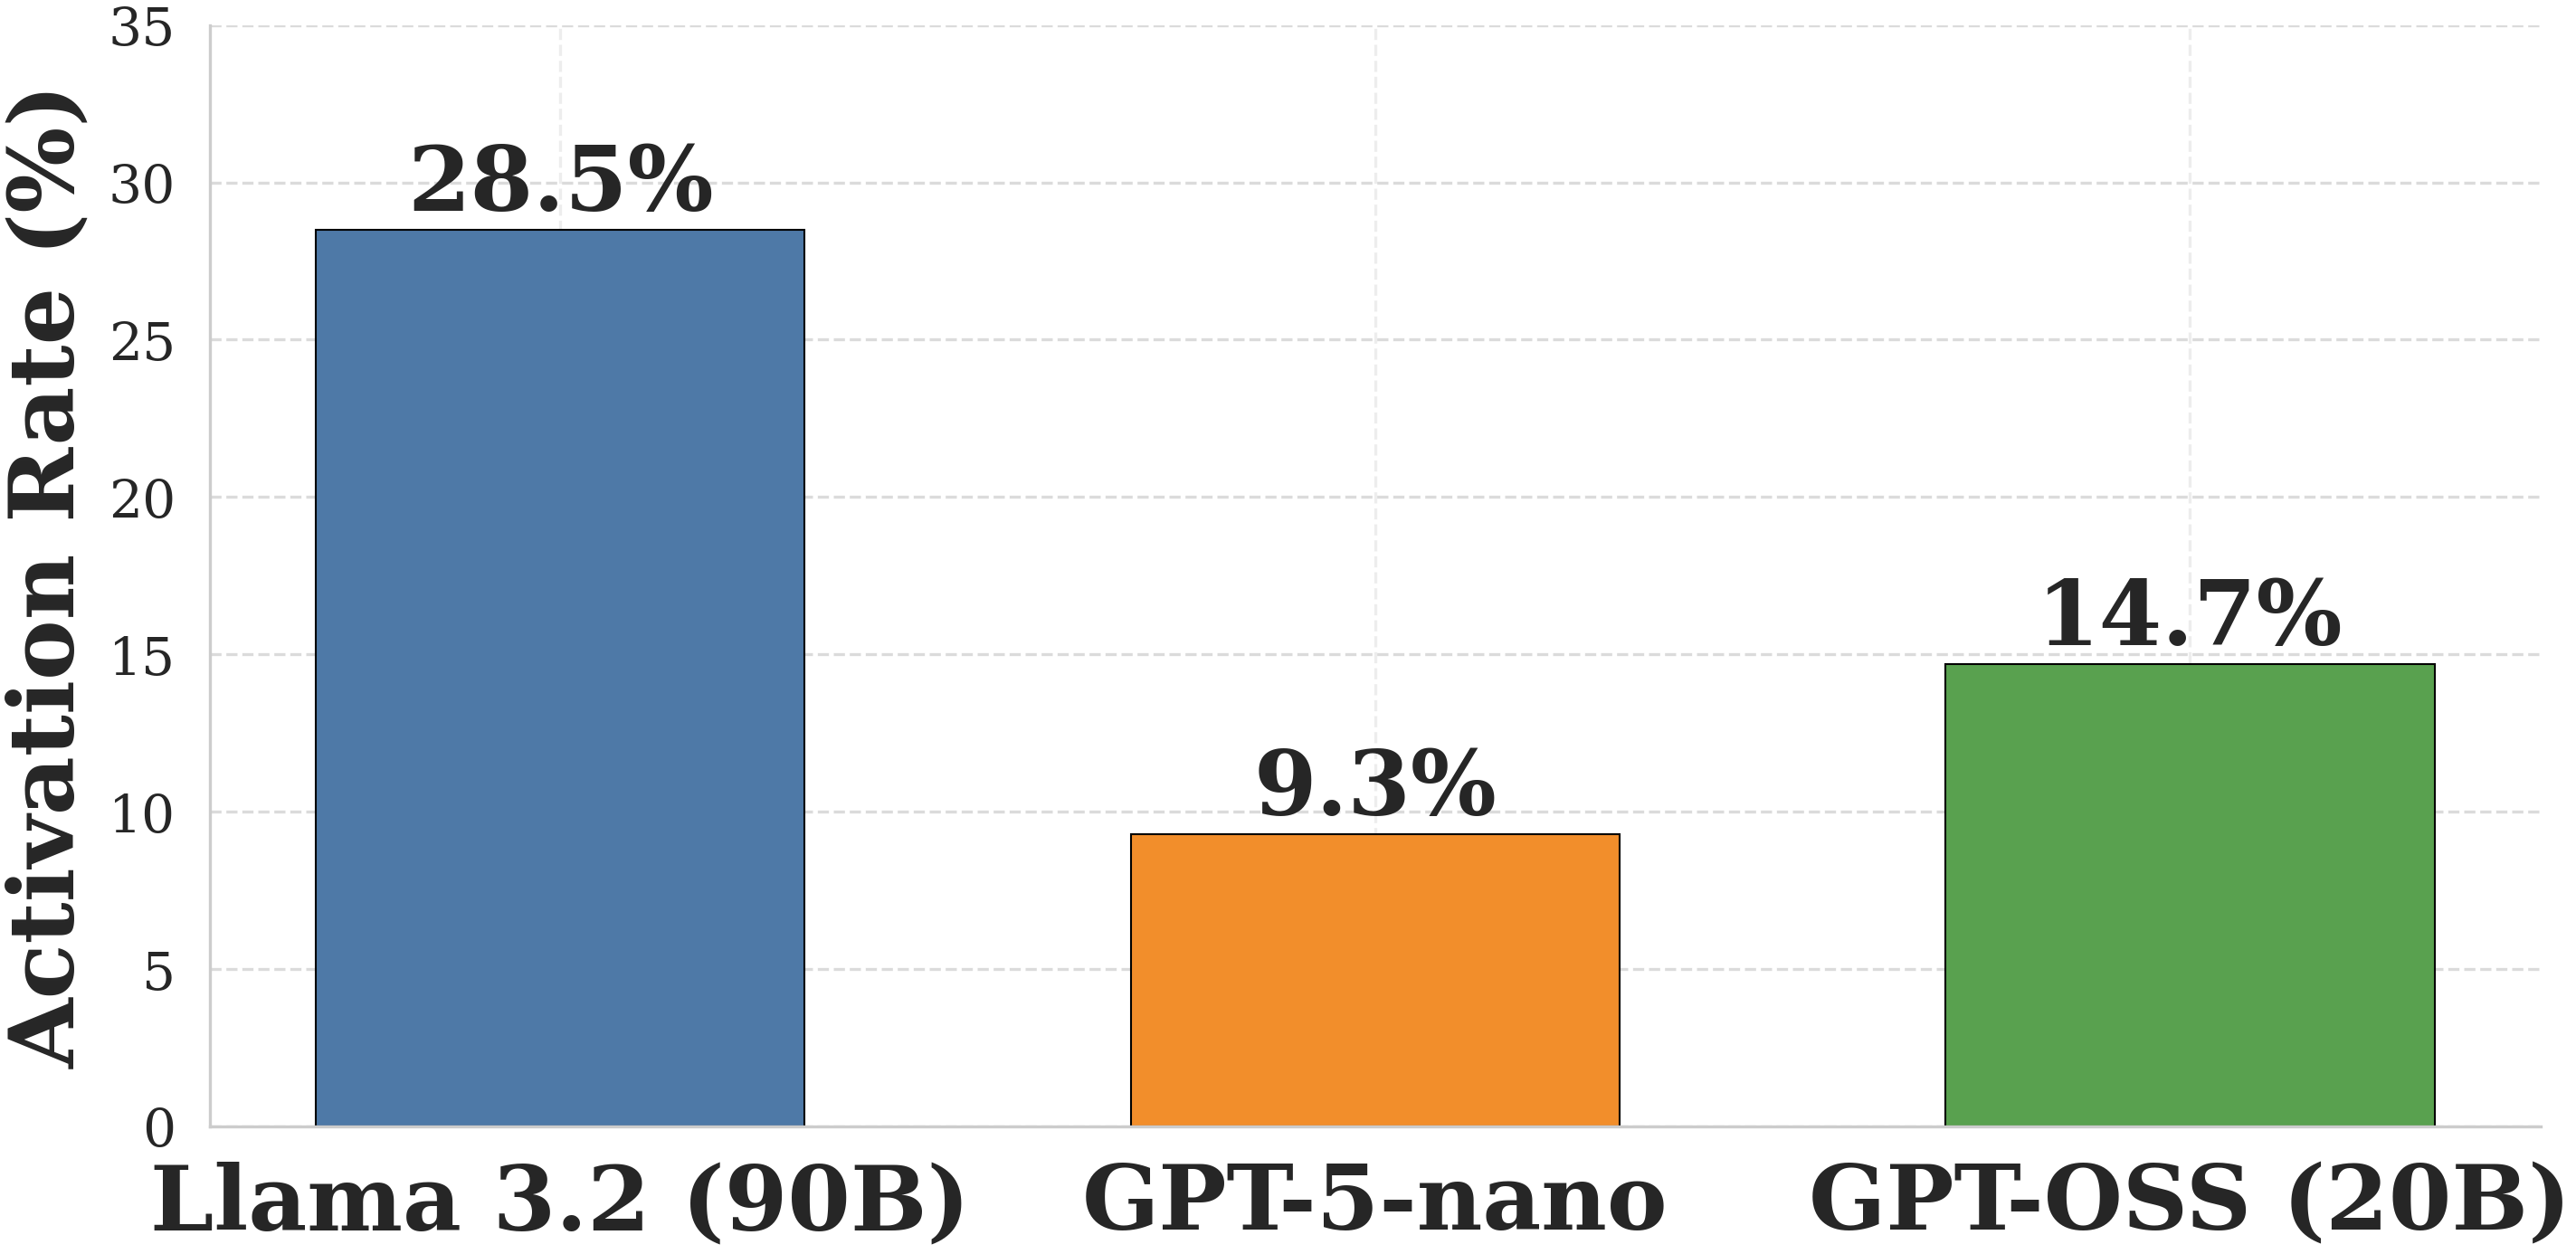
The image is a bar chart comparing the activation rates of three different language models: Llama 3.2 (90B), GPT-5-nano, and GPT-OSS (20B). The chart displays the activation rate in percentage on the y-axis and the language models on the x-axis.
### Components/Axes
* **X-axis:** Represents the language models. The labels are:
* Llama 3.2 (90B)
* GPT-5-nano
* GPT-OSS (20B)
* **Y-axis:** Represents the activation rate in percentage (%). The scale ranges from 0 to 35, with gridlines at intervals of 5.
* **Bars:** Each bar represents a language model, with the height corresponding to its activation rate.
* Llama 3.2 (90B): Blue bar
* GPT-5-nano: Orange bar
* GPT-OSS (20B): Green bar
### Detailed Analysis
* **Llama 3.2 (90B):** The blue bar reaches approximately 28.5%.
* **GPT-5-nano:** The orange bar reaches approximately 9.3%.
* **GPT-OSS (20B):** The green bar reaches approximately 14.7%.
### Key Observations
* Llama 3.2 (90B) has the highest activation rate among the three models, at 28.5%.
* GPT-5-nano has the lowest activation rate, at 9.3%.
* GPT-OSS (20B) has an activation rate of 14.7%, which is between the other two models.
### Interpretation
The bar chart provides a direct comparison of the activation rates of three different language models. The data suggests that Llama 3.2 (90B) has a significantly higher activation rate compared to GPT-5-nano and GPT-OSS (20B). This could indicate differences in the model architectures, training data, or other factors that influence activation behavior. The difference in activation rates may correlate with model performance or efficiency, but further analysis would be needed to draw definitive conclusions.