## Bar Chart: Model Activation Rates
### Overview
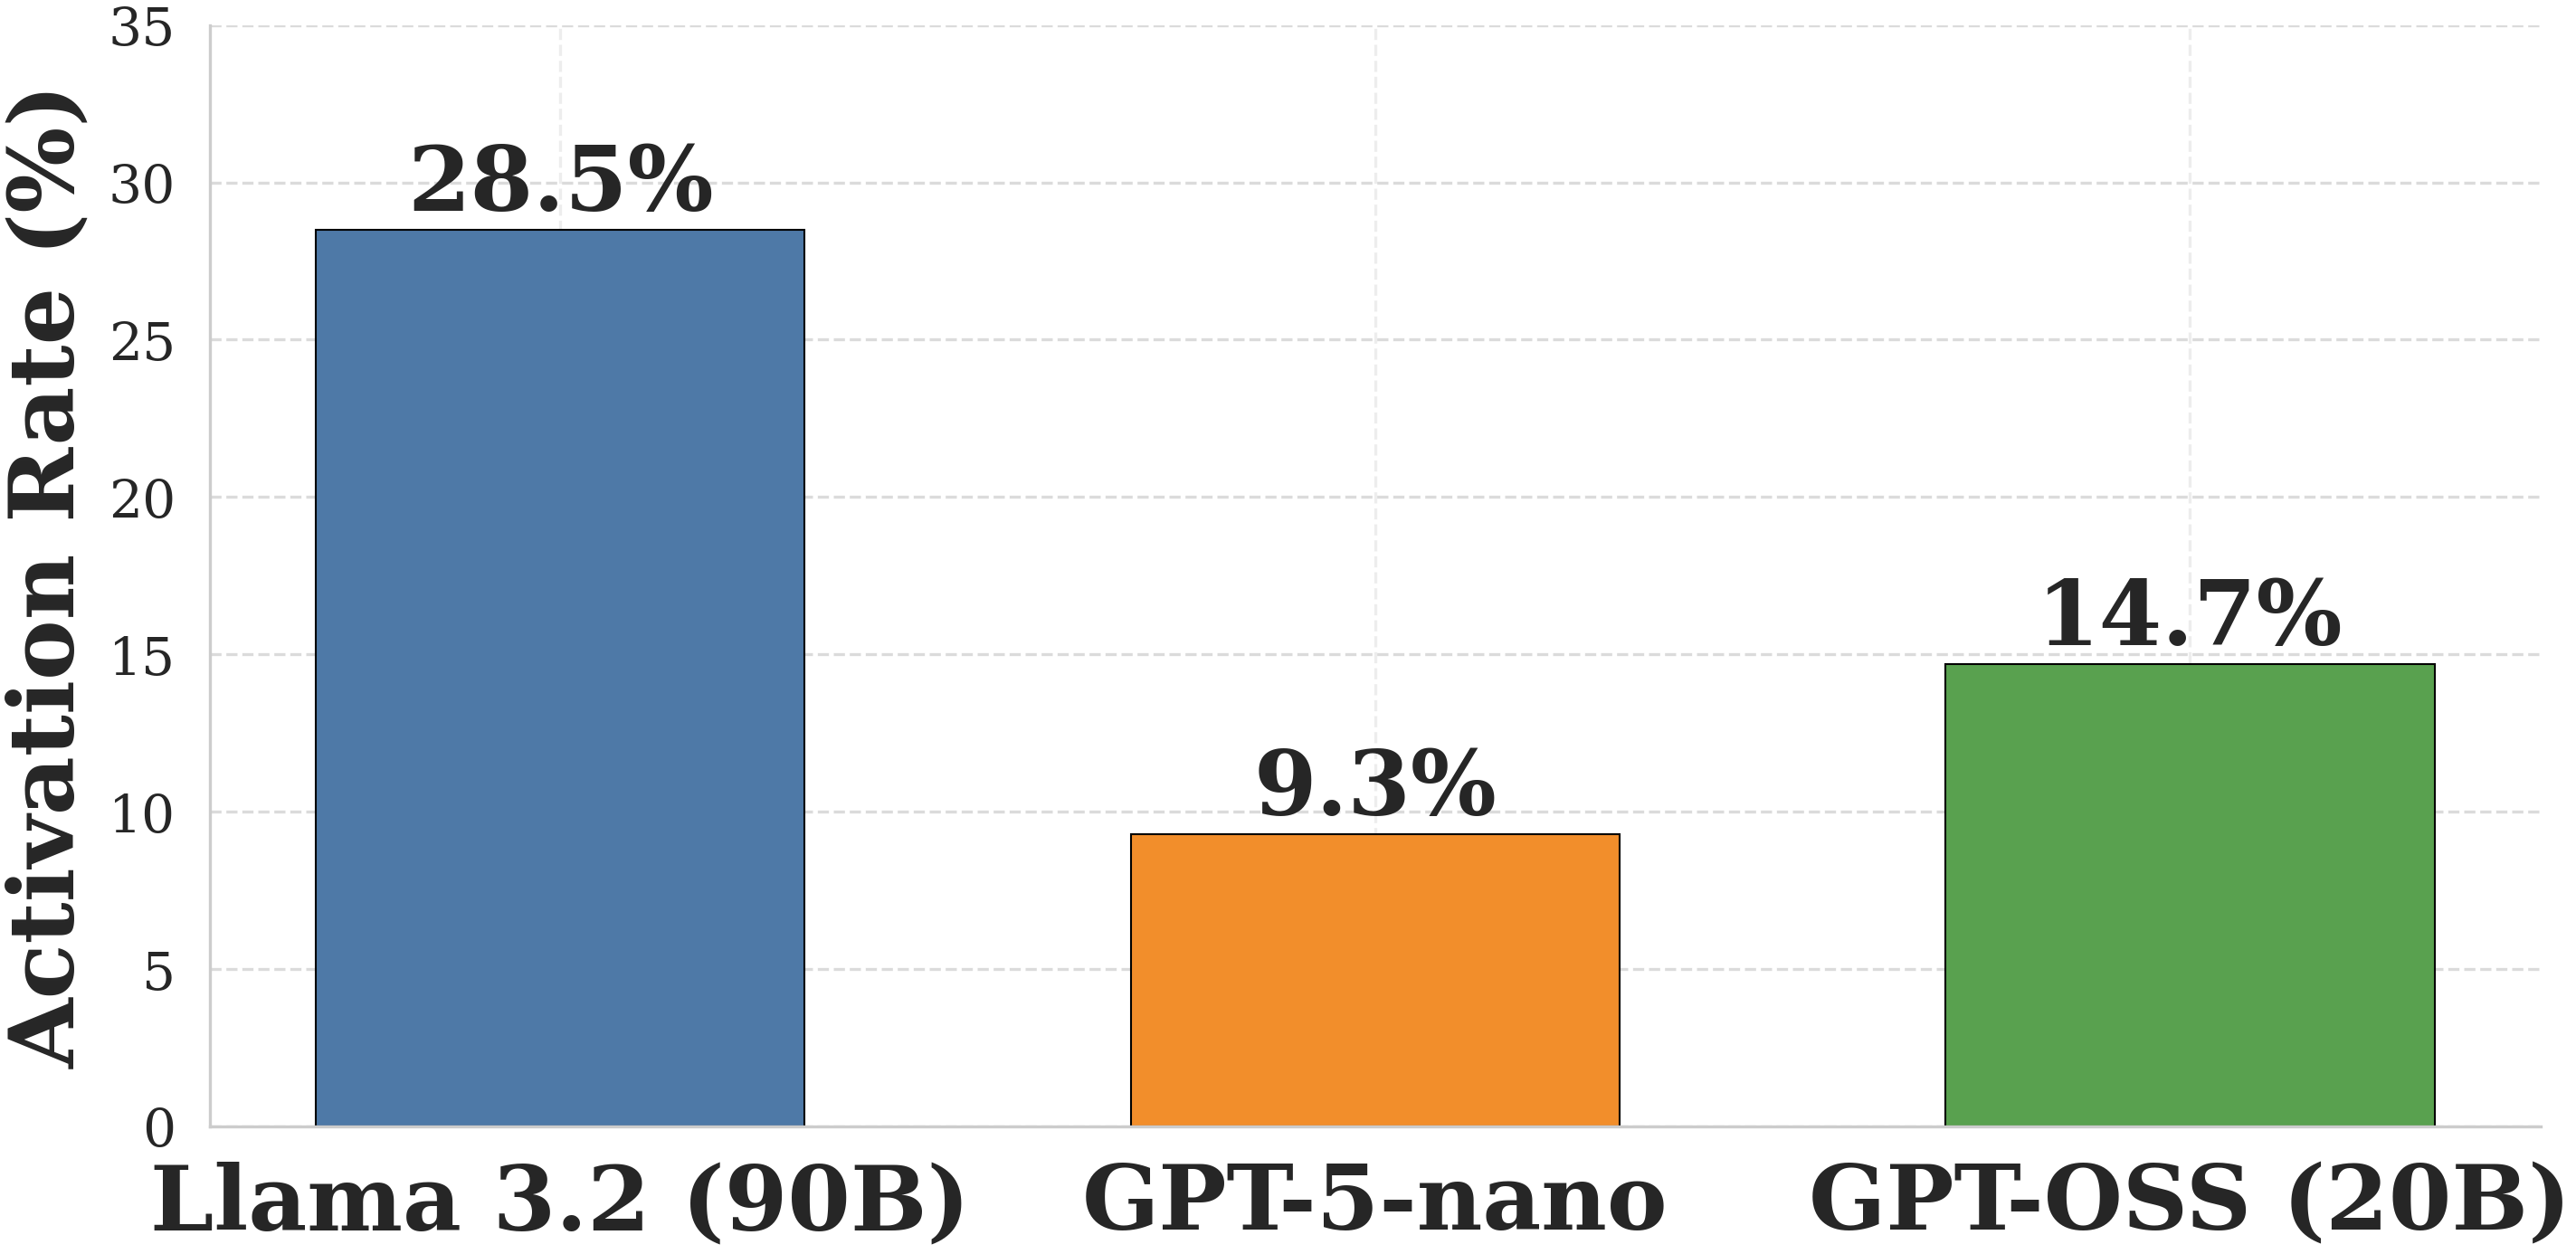
This image is a vertical bar chart comparing a metric called "Activation Rate (%)" across three different large language models. The chart uses distinct colors for each model and provides exact percentage labels above each corresponding bar. The language used in the chart is entirely English.
### Components/Axes
**Left Region (Y-Axis):**
* **Title:** "Activation Rate (%)" (Rotated 90 degrees counter-clockwise, reading bottom to top).
* **Scale:** Ranges from 0 to 35.
* **Markers:** Numerical markers are placed at intervals of 5: 0, 5, 10, 15, 20, 25, 30, and 35.
* **Gridlines:** Light gray, dashed horizontal lines extend from each Y-axis marker across the background of the chart area to aid in visual estimation.
**Bottom Region (X-Axis):**
* **Labels (Categories):** Three distinct categorical labels are positioned horizontally beneath the bars. From left to right:
1. "Llama 3.2 (90B)"
2. "GPT-5-nano"
3. "GPT-OSS (20B)"
**Legend:**
* There is no standalone legend box. Instead, the X-axis labels serve as the category identifiers, and each category is assigned a unique color in the main chart area.
### Detailed Analysis
**Trend Verification:**
Visually, the chart displays a clear hierarchy. The bar on the far left is the tallest, reaching near the top of the Y-axis scale. The middle bar is the shortest, sitting below the second gridline. The bar on the right is of medium height, sitting just below the third gridline. The explicit numerical labels confirm this visual trend.
**Data Extraction (Center Region):**
* **Data Point 1 (Left):**
* **Category:** Llama 3.2 (90B)
* **Color:** Solid Blue with a thin black border.
* **Visual Placement:** The top of the bar rests between the 25 and 30 gridlines, closer to the 30.
* **Explicit Value:** **28.5%** (Printed in bold black text directly above the bar).
* **Data Point 2 (Center):**
* **Category:** GPT-5-nano
* **Color:** Solid Orange with a thin black border.
* **Visual Placement:** The top of the bar rests just below the 10 gridline.
* **Explicit Value:** **9.3%** (Printed in bold black text directly above the bar).
* **Data Point 3 (Right):**
* **Category:** GPT-OSS (20B)
* **Color:** Solid Green with a thin black border.
* **Visual Placement:** The top of the bar rests just below the 15 gridline.
* **Explicit Value:** **14.7%** (Printed in bold black text directly above the bar).
### Key Observations
* **Dominant Value:** Llama 3.2 (90B) has the highest activation rate by a wide margin. It is more than three times higher than GPT-5-nano and nearly double that of GPT-OSS (20B).
* **Lowest Value:** GPT-5-nano exhibits the lowest activation rate, being the only model to fall below the 10% threshold.
* **Parameter Inclusion:** Two of the three models explicitly list their parameter counts in billions ("90B" and "20B"). The middle model uses the suffix "nano," which implies a very small parameter count, though an exact number is not provided.
### Interpretation
* **Correlation with Model Size:** There appears to be a direct, positive correlation between the size of the model and its "Activation Rate." The largest model explicitly listed (90B) has the highest rate (28.5%). The mid-sized model (20B) has a mid-tier rate (14.7%). The model designated as "nano" (implying the smallest architecture) has the lowest rate (9.3%).
* **Contextual Meaning of "Activation Rate":** Without the surrounding document, the exact definition of "Activation Rate" is ambiguous.
* *If positive (e.g., successful tool use, reasoning pathway activation, or sparsity efficiency):* The data suggests that larger parameter counts drastically improve this capability, making Llama 3.2 vastly superior.
* *If negative (e.g., safety filter triggers, refusal rates, or hallucination triggers):* The data would suggest that smaller models are less prone to triggering these unwanted states, making the "nano" model the most unrestrictive or efficient in this specific context.
* **Investigative Note on Nomenclature:** The inclusion of "GPT-5-nano" and "GPT-OSS" suggests this chart may originate from a forward-looking research paper, a speculative benchmark, or an internal corporate presentation, as these are not standard, universally deployed models under those exact public names at the time of standard GPT-4/Llama-3 eras. The chart is designed to explicitly compare a known open-weight architecture (Llama) against proprietary/hypothetical architectures (GPT variants) across different scale classes.