\n
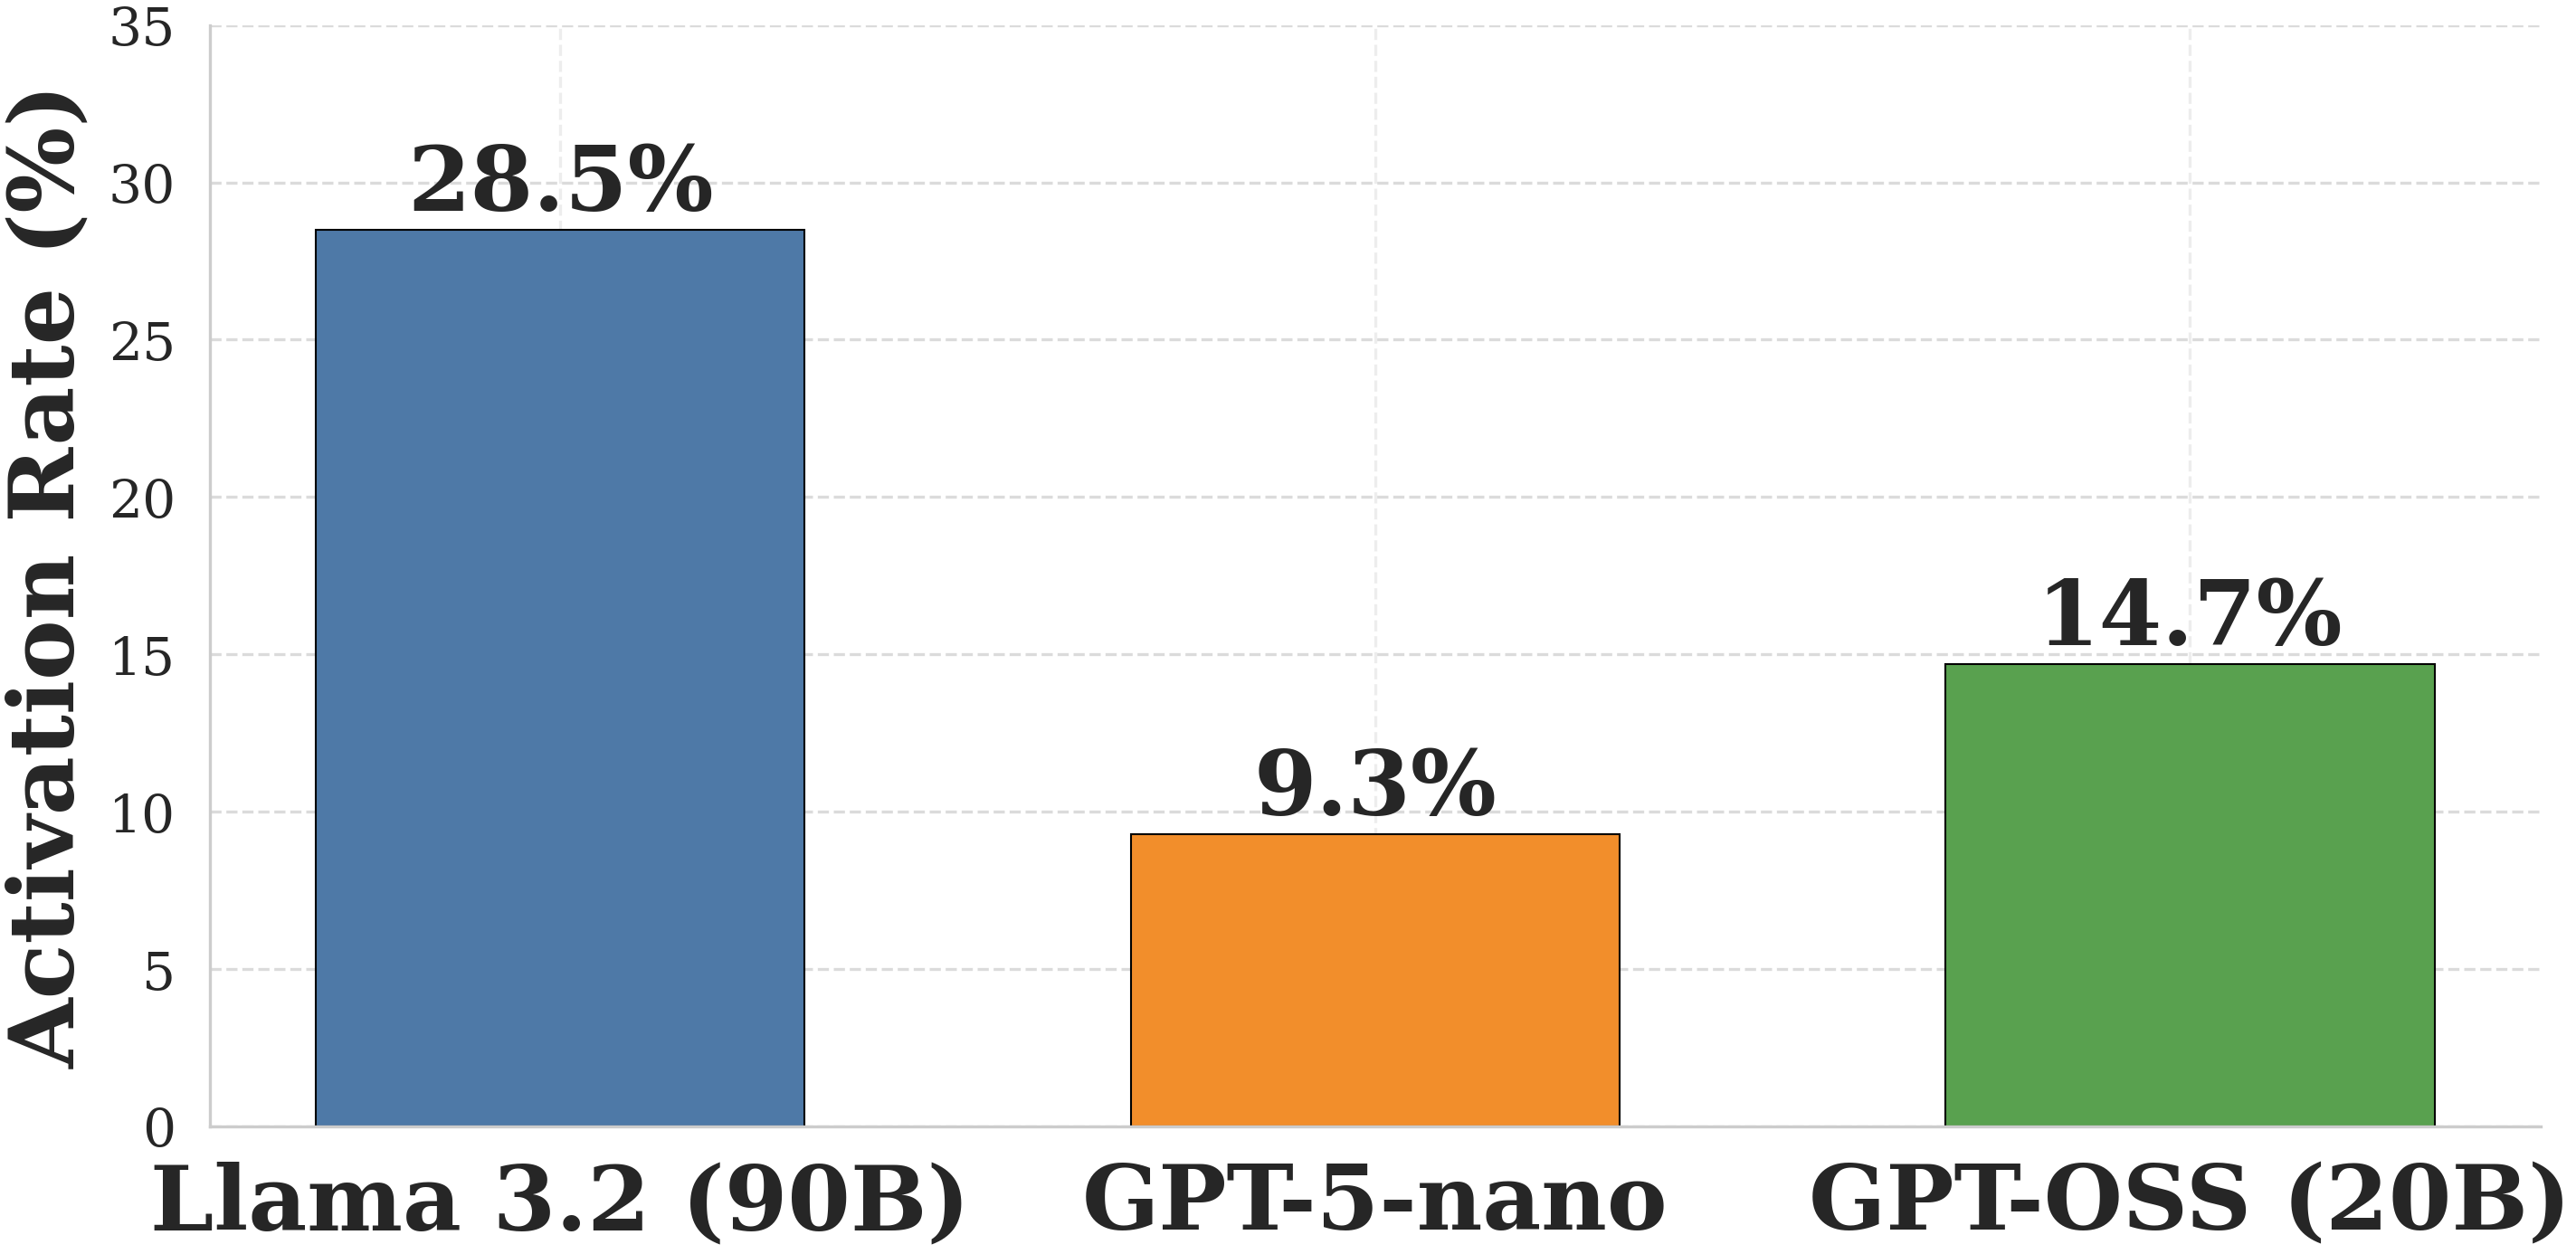
## Bar Chart: Activation Rates of Language Models
### Overview
This is a bar chart comparing the activation rates of three different language models: Llama 3.2 (90B), GPT-5-nano, and GPT-OSS (20B). The activation rate is measured in percentage and represented by the height of each bar.
### Components/Axes
* **X-axis:** Represents the language models: Llama 3.2 (90B), GPT-5-nano, and GPT-OSS (20B).
* **Y-axis:** Represents the Activation Rate (%). The scale ranges from 0 to 35, with tick marks at intervals of 5.
* **Bars:** Three vertical bars, each representing a language model's activation rate.
* Llama 3.2 (90B) - Blue
* GPT-5-nano - Orange
* GPT-OSS (20B) - Green
* **Data Labels:** Each bar has a label indicating the exact activation rate percentage, positioned above the bar.
### Detailed Analysis
* **Llama 3.2 (90B):** The blue bar has a height corresponding to approximately 28.5%. The label above the bar confirms this value.
* **GPT-5-nano:** The orange bar has a height corresponding to approximately 9.3%. The label above the bar confirms this value.
* **GPT-OSS (20B):** The green bar has a height corresponding to approximately 14.7%. The label above the bar confirms this value.
### Key Observations
The activation rate varies significantly between the models. Llama 3.2 (90B) exhibits the highest activation rate, followed by GPT-OSS (20B), and then GPT-5-nano. The difference between Llama 3.2 (90B) and GPT-5-nano is particularly large.
### Interpretation
The data suggests that the size of the language model (as indicated by the number of parameters in brackets) correlates with its activation rate. Llama 3.2 (90B), the largest model, has the highest activation rate, while GPT-5-nano, the smallest, has the lowest. GPT-OSS (20B) falls in between. Activation rate could be interpreted as the frequency with which the model's neurons are activated during processing, potentially indicating its level of engagement or utilization of its capacity. A higher activation rate might suggest a more complex or active processing style. The data implies that larger models are more actively engaged during operation, but this does not necessarily equate to better performance. Further analysis would be needed to determine the relationship between activation rate and other performance metrics.