# Technical Document Extraction: Activation Rate Bar Chart
## Chart Overview
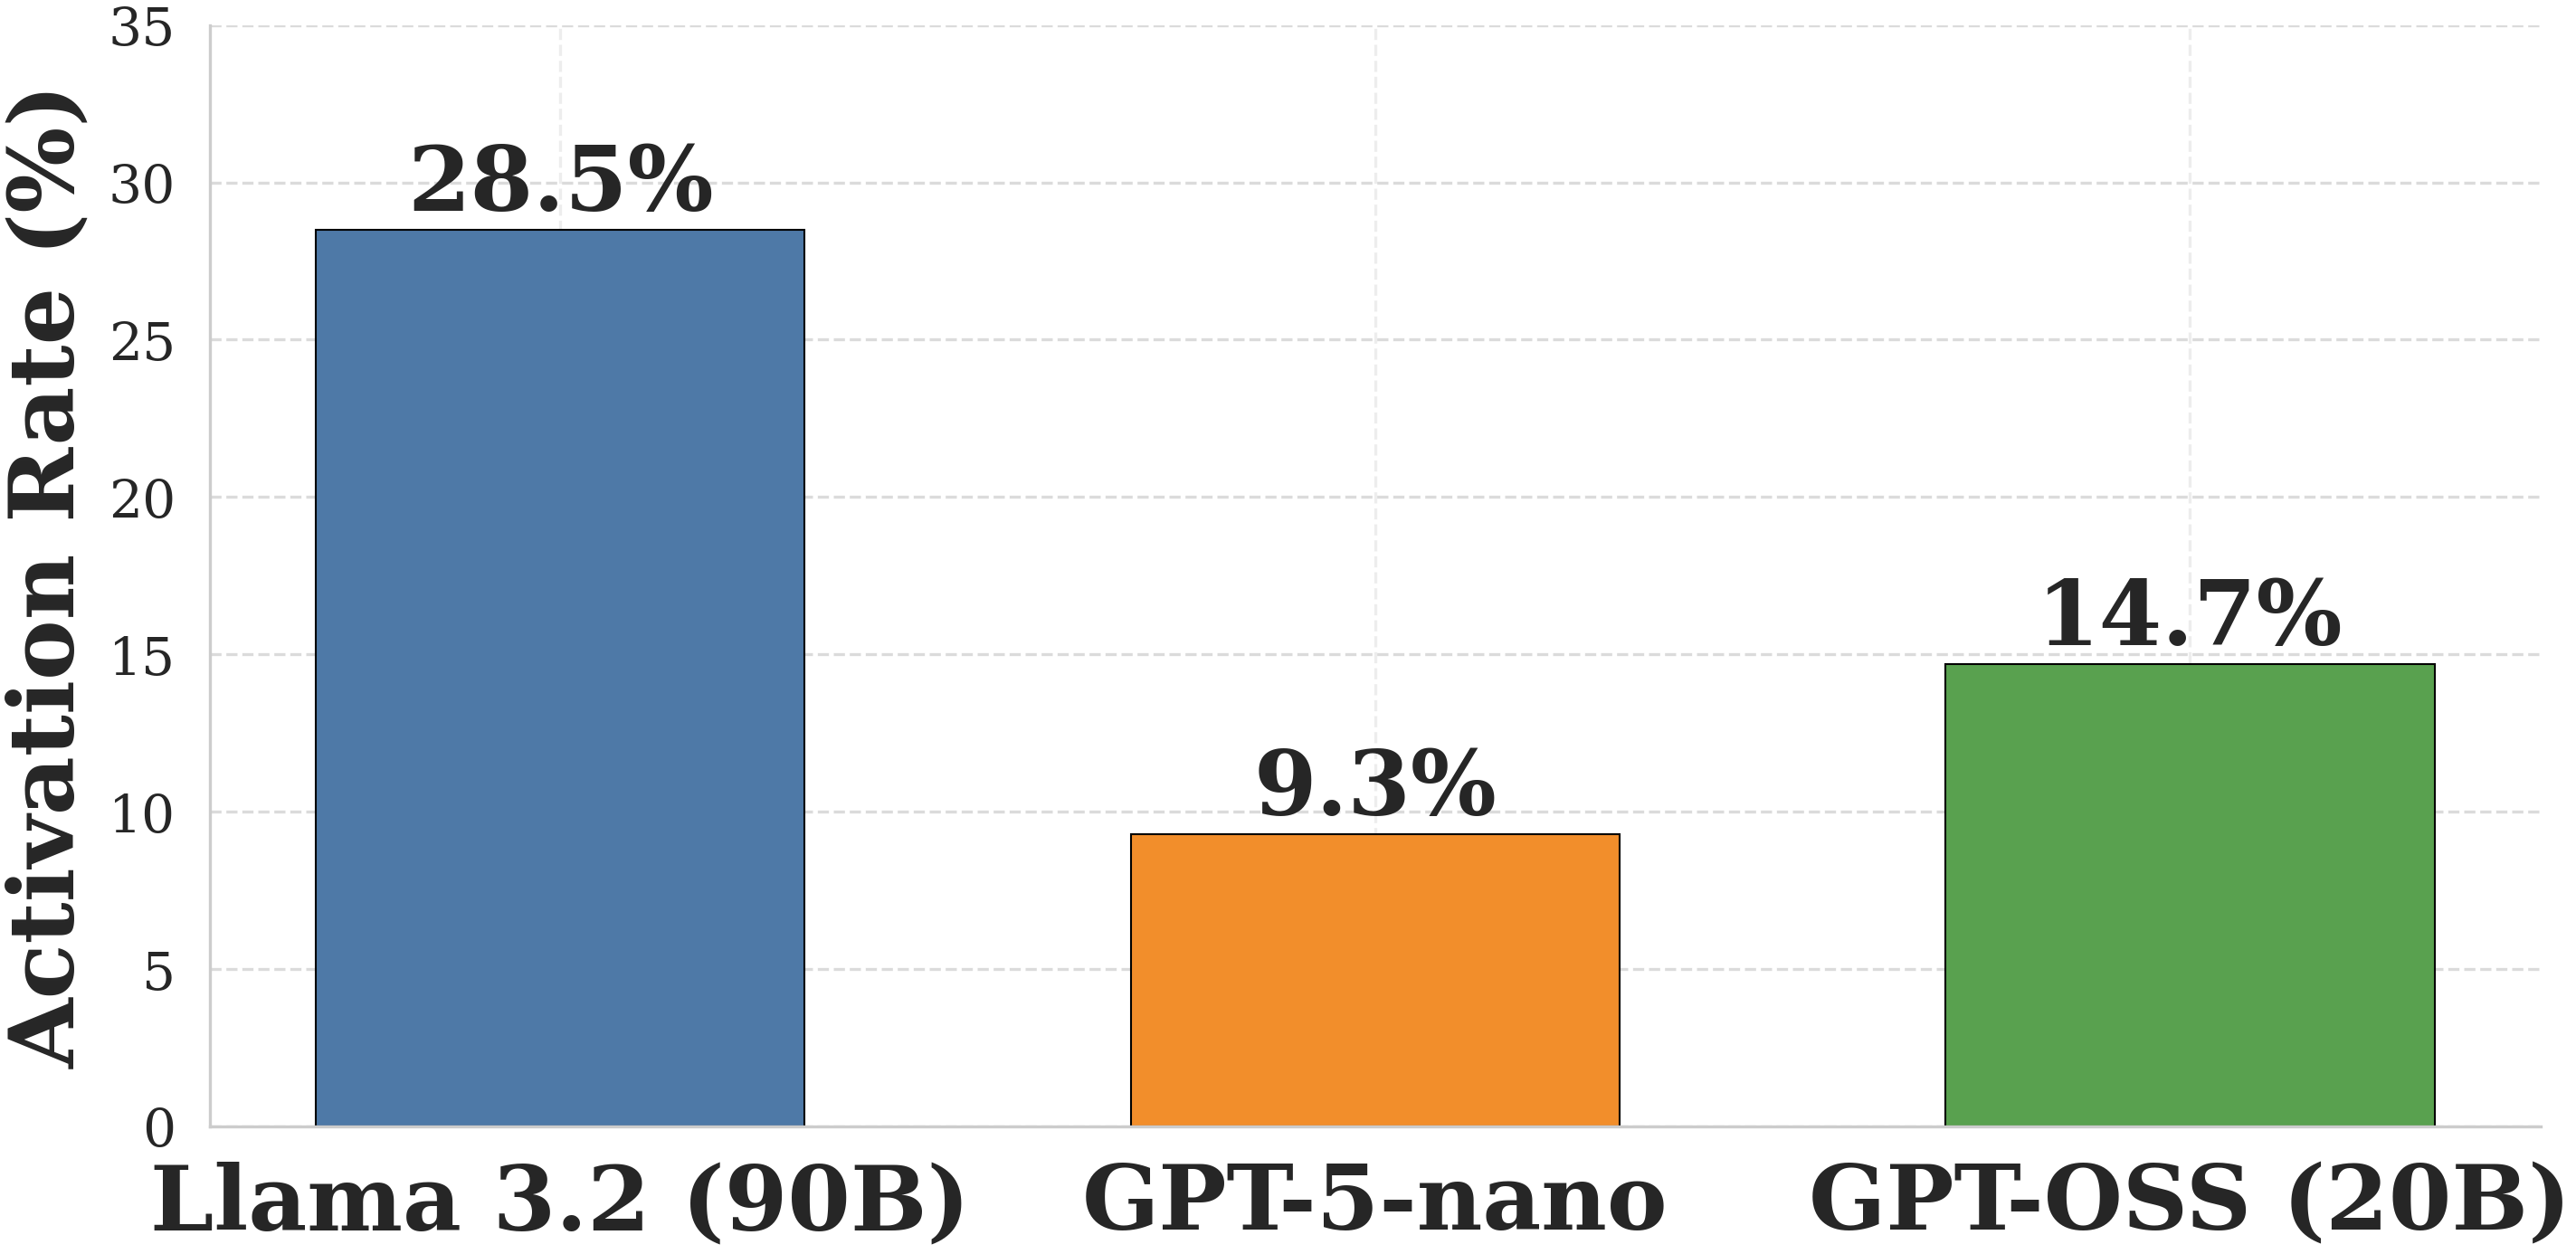
The image is a vertical bar chart comparing activation rates across three AI models. Key elements include:
### Axis Labels
- **X-axis**: Model names with parameter counts
- Llama 3.2 (90B)
- GPT-5-nano
- GPT-OSS (20B)
- **Y-axis**: "Activation Rate (%)" with range 0–35%
### Data Points & Visual Encoding
1. **Llama 3.2 (90B)**
- Color: Blue
- Activation Rate: 28.5%
- Position: Leftmost bar
2. **GPT-5-nano**
- Color: Orange
- Activation Rate: 9.3%
- Position: Middle bar
3. **GPT-OSS (20B)**
- Color: Green
- Activation Rate: 14.7%
- Position: Rightmost bar
### Legend & Spatial Grounding
- Legend is implicit via bar colors:
- Blue → Llama 3.2 (90B)
- Orange → GPT-5-nano
- Green → GPT-OSS (20B)
- All data points match legend colors exactly.
### Trend Verification
- **Llama 3.2 (90B)**: Tallest bar (28.5%) dominates chart
- **GPT-5-nano**: Shortest bar (9.3%) indicates lowest activation
- **GPT-OSS (20B)**: Intermediate height (14.7%) between the two
### Structural Notes
- No additional text, heatmaps, or complex diagrams present
- Chart uses solid colors for categorical differentiation
- No gridlines visible beyond axis markers
## Data Table Reconstruction
| Model | Parameter Size | Activation Rate (%) | Color |
|------------------|----------------|----------------------|--------|
| Llama 3.2 | 90B | 28.5 | Blue |
| GPT-5-nano | N/A | 9.3 | Orange |
| GPT-OSS | 20B | 14.7 | Green |
## Language & Localization
- All text in English
- No non-English content detected