# Technical Document Extraction: Mem-slots Parameter Tuning Chart
## 1. Chart Title
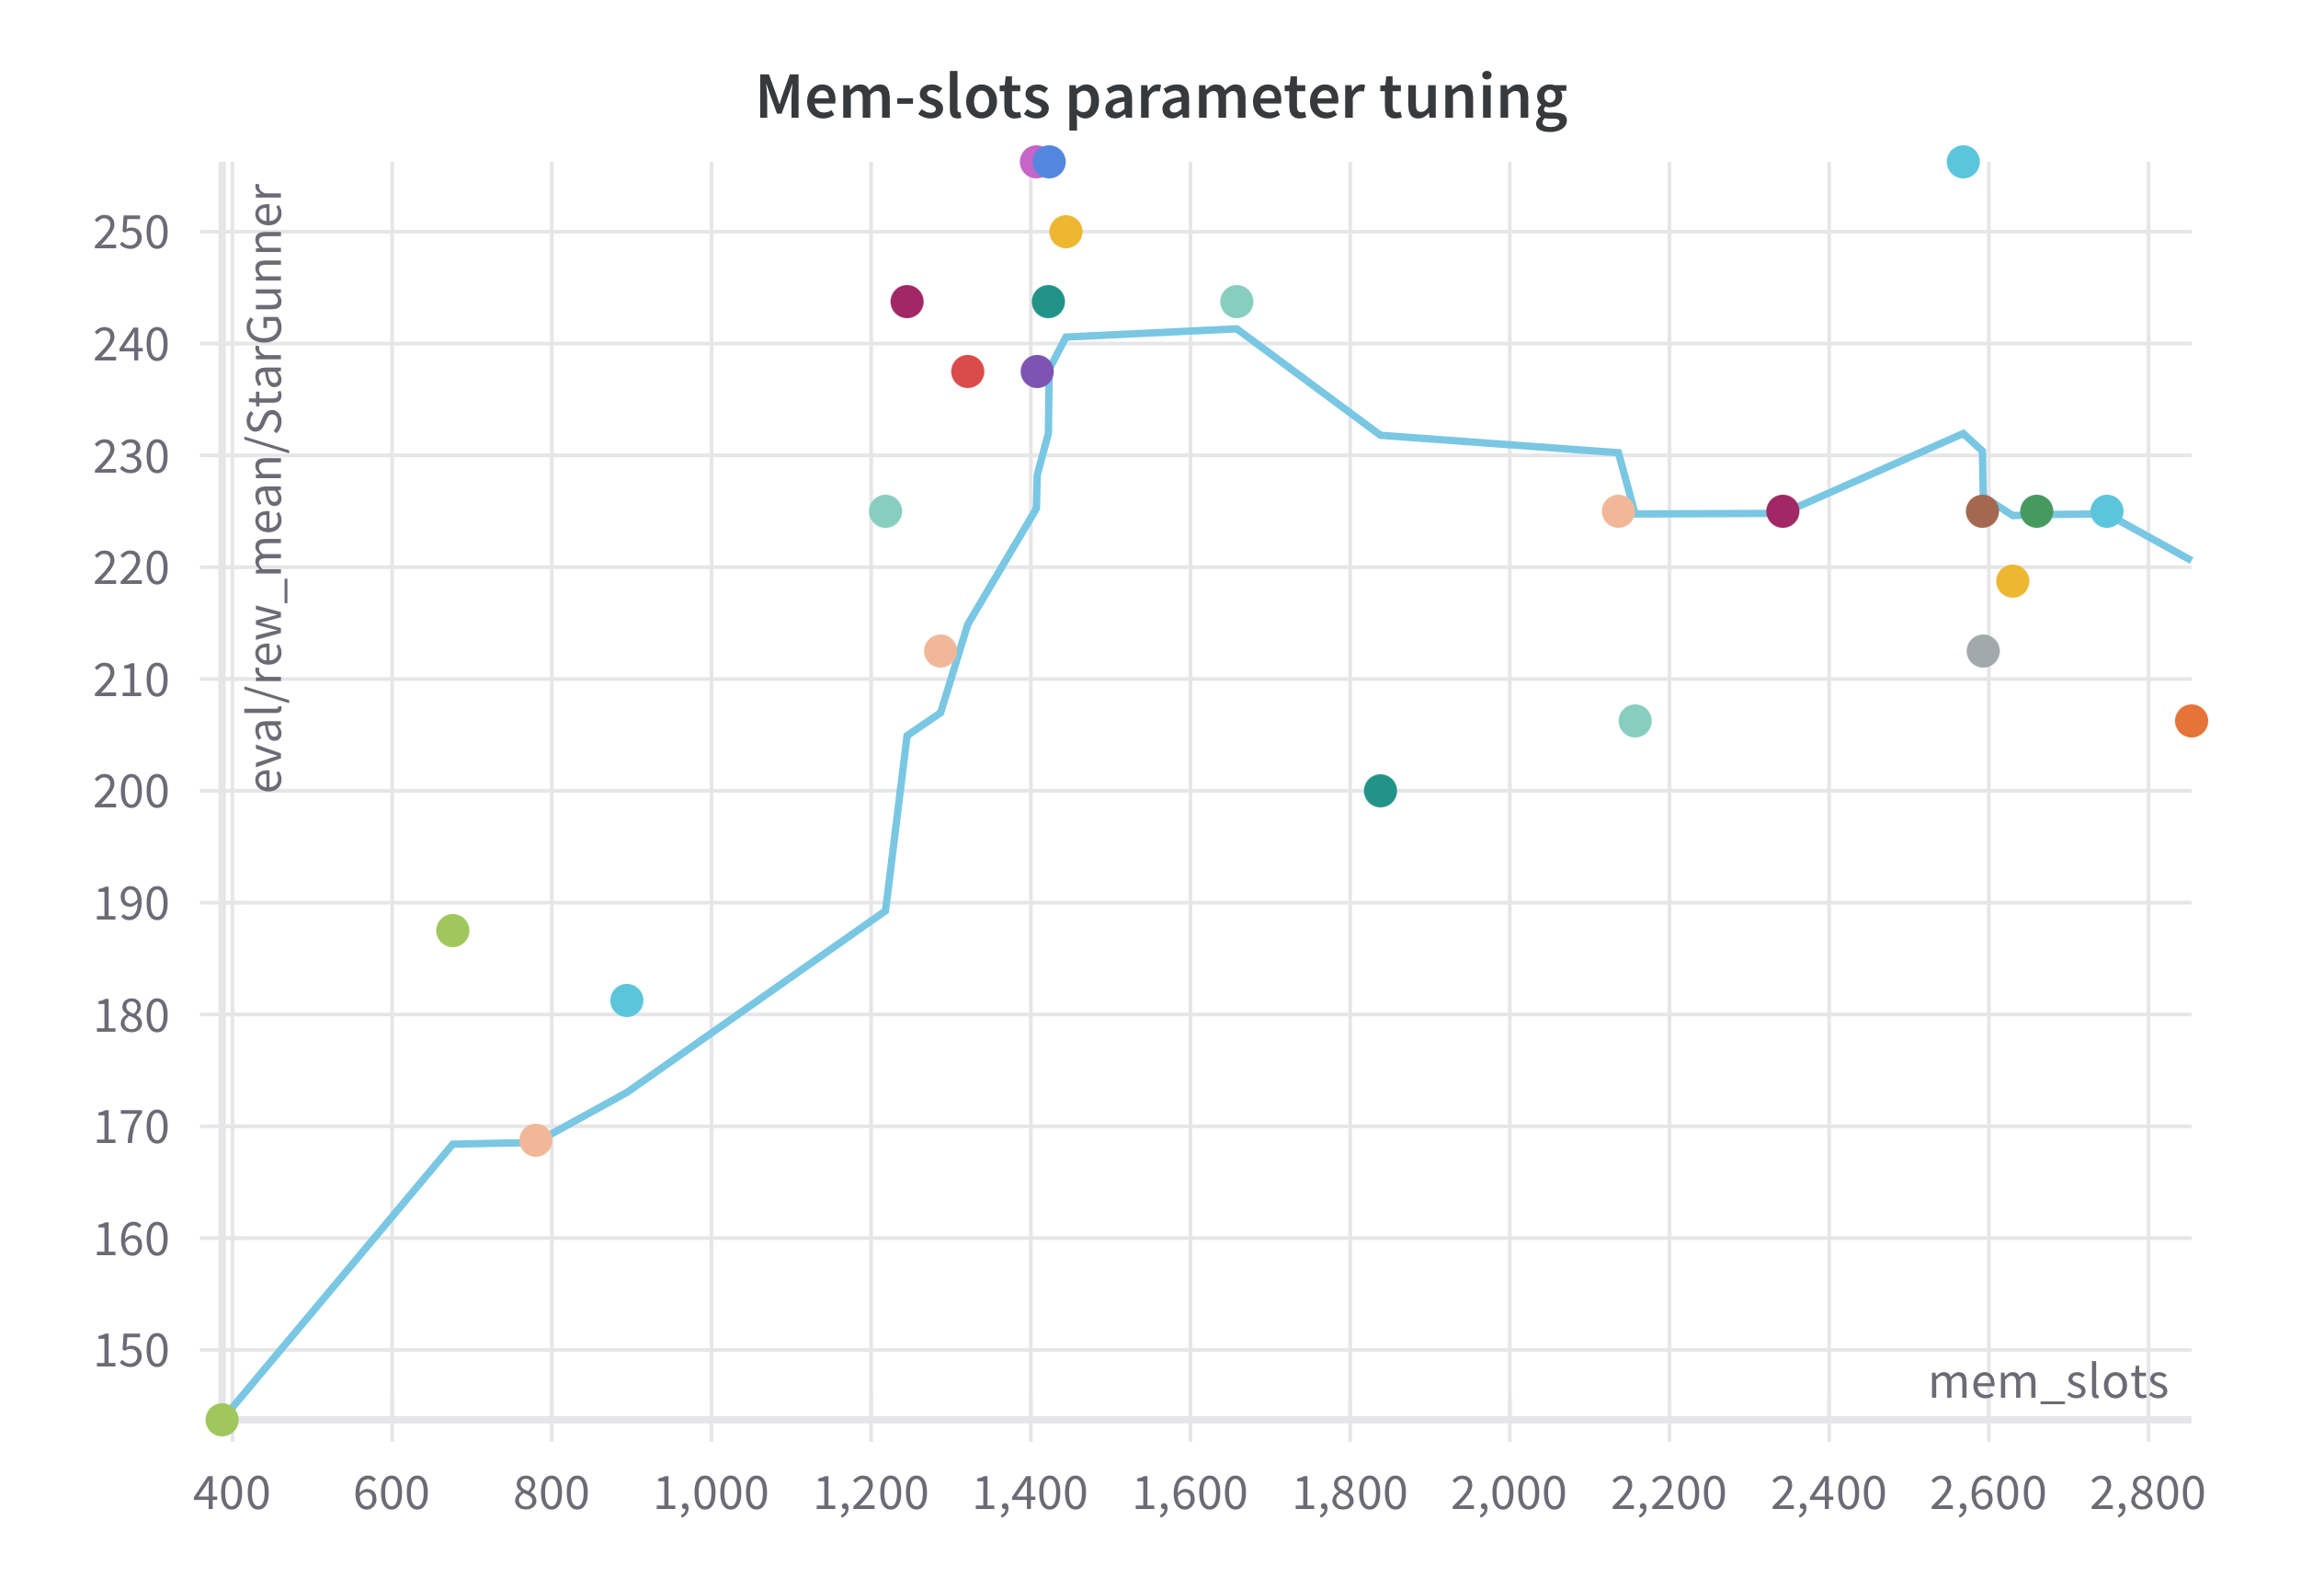
**Title:** Mem-slots parameter tuning
## 2. Axes and Labels
- **X-axis (Horizontal):**
- Label: `mem_slots`
- Range: 400 to 2800 (in increments of 200)
- Tick marks: 400, 600, 800, 1000, 1200, 1400, 1600, 1800, 2000, 2200, 2400, 2600, 2800
- **Y-axis (Vertical):**
- Label: `eval/rew_mean/StarGunner`
- Range: 150 to 250 (in increments of 10)
- Tick marks: 150, 160, 170, 180, 190, 200, 210, 220, 230, 240, 250
## 3. Legend
- **Location:** Bottom-right corner
- **Labels and Colors:**
- `StarGunner` (blue)
- `StarGunner2` (purple)
- `StarGunner3` (orange)
- `StarGunner4` (teal)
- `StarGunner5` (red)
- `StarGunner6` (yellow)
- `StarGunner7` (green)
- `StarGunner8` (gray)
- `StarGunner9` (light blue)
- `StarGunner10` (dark blue)
## 4. Data Points and Trends
### Line (Blue, labeled "StarGunner"):
- **Trend:**
- Starts at `(400, 140)`
- Sharp upward slope until `(1400, 250)` (peak)
- Gradual decline after `1400`, plateauing around `230-240` from `1600` to `2400`
- Final drop to `(2800, 220)`
### Scattered Data Points:
| Label | Color | Coordinates (x, y) | Notes |
|-------------------|---------|--------------------|-------|
| StarGunner2 | Purple | (1400, 250) | Peak of the line |
| StarGunner3 | Orange | (1200, 225) | On rising slope |
| StarGunner4 | Teal | (1600, 240) | On plateau |
| StarGunner5 | Red | (1400, 235) | Near peak |
| StarGunner6 | Yellow | (2600, 230) | On descending slope |
| StarGunner7 | Green | (2400, 225) | Near end of plateau |
| StarGunner8 | Gray | (2200, 215) | Post-plateau decline |
| StarGunner9 | Light Blue | (2000, 220) | Mid-plateau |
| StarGunner10 | Dark Blue | (2800, 205) | Final data point |
## 5. Key Observations
- The line (`StarGunner`) shows a **non-linear relationship** between `mem_slots` and `eval/rew_mean/StarGunner`, with a sharp increase up to `1400` followed by a plateau and gradual decline.
- Data points (`StarGunner2-10`) are distributed across the chart, with some aligning closely to the line (e.g., `StarGunner2` at the peak) and others deviating (e.g., `StarGunner10` at `(2800, 205)`).
- The legend confirms color-to-label mappings, ensuring consistency between the line and scattered points.
## 6. Spatial Grounding
- **Legend Position:** Bottom-right corner (outside the plot area).
- **Data Point Alignment:** Colors of scattered points match legend labels (e.g., `StarGunner2` is purple, `StarGunner3` is orange).
## 7. Trend Verification
- **Line A (StarGunner):**
- Slope: Upward (400→1400), then flat (1400→2400), then downward (2400→2800).
- Confirmed by data points like `(1400, 250)` (peak) and `(2800, 220)` (final value).
## 8. Component Isolation
- **Header:** Chart title centered at the top.
- **Main Chart:** Line and data points occupying the majority of the image.
- **Footer:** Legend at the bottom-right.
## 9. Missing Elements
- No data table or additional textual annotations present.
- No other languages detected; all text is in English.
## 10. Final Notes
- The chart emphasizes parameter tuning for `mem_slots`, with `StarGunner` as the primary reference line.
- Scattered data points likely represent alternative configurations or experimental results.