## Scatter Plots: Zero-Shot Classifier vs. Verbal vs. Fine-tune Performance
### Overview
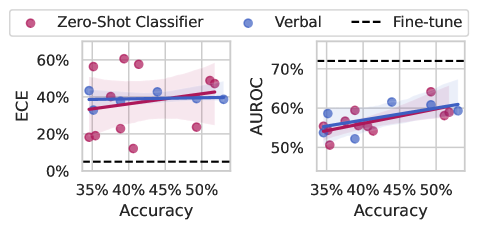
The image displays two side-by-side scatter plots comparing the performance of three classification methods: "Zero-Shot Classifier," "Verbal," and "Fine-tune." The left plot evaluates Expected Calibration Error (ECE) against Accuracy, while the right plot evaluates Area Under the ROC Curve (AUROC) against Accuracy. Each plot includes individual data points, a linear regression trend line with a shaded confidence interval for the first two methods, and a horizontal dashed reference line for the "Fine-tune" method.
### Components/Axes
* **Legend:** Positioned at the top center of the entire figure.
* Pink circle: `Zero-Shot Classifier`
* Blue circle: `Verbal`
* Black dashed line: `Fine-tune`
* **Left Plot (ECE vs. Accuracy):**
* **Y-axis:** Label is `ECE`. Scale ranges from 0% to 60%, with major ticks at 0%, 20%, 40%, 60%.
* **X-axis:** Label is `Accuracy`. Scale ranges from 35% to 50%, with major ticks at 35%, 40%, 45%, 50%.
* **Right Plot (AUROC vs. Accuracy):**
* **Y-axis:** Label is `AUROC`. Scale ranges from 50% to 70%, with major ticks at 50%, 60%, 70%.
* **X-axis:** Label is `Accuracy`. Scale ranges from 35% to 50%, with major ticks at 35%, 40%, 45%, 50%.
* **Data Series & Visual Elements:**
* **Zero-Shot Classifier (Pink):** Individual pink dots scattered across the plot area. A solid pink regression line with a light pink shaded confidence interval is drawn through the data.
* **Verbal (Blue):** Individual blue dots scattered across the plot area. A solid blue regression line with a light blue shaded confidence interval is drawn through the data.
* **Fine-tune (Black Dashed):** A horizontal dashed black line, indicating a constant performance level for this method across the accuracy range shown.
### Detailed Analysis
**Left Plot: ECE (Lower is Better)**
* **Trend Verification:** Both the pink (Zero-Shot) and blue (Verbal) regression lines show a slight upward slope, suggesting a weak positive correlation between Accuracy and ECE for these methods.
* **Data Points (Approximate):**
* **Zero-Shot Classifier (Pink):** Points are widely scattered. Values range from approximately 10% to 60% ECE. Notable points include a cluster near 40% Accuracy/20% ECE and another near 50% Accuracy/50% ECE.
* **Verbal (Blue):** Points are more tightly clustered than Zero-Shot. Values range from approximately 30% to 50% ECE.
* **Fine-tune (Black Dashed Line):** Constant at approximately **5% ECE**, significantly lower than the other two methods across the entire accuracy range.
**Right Plot: AUROC (Higher is Better)**
* **Trend Verification:** Both the pink (Zero-Shot) and blue (Verbal) regression lines show a clear upward slope, indicating a positive correlation between Accuracy and AUROC.
* **Data Points (Approximate):**
* **Zero-Shot Classifier (Pink):** Points range from approximately 50% to 65% AUROC. There is a visible upward trend.
* **Verbal (Blue):** Points range from approximately 55% to 62% AUROC, also showing an upward trend.
* **Fine-tune (Black Dashed Line):** Constant at approximately **72% AUROC**, which is higher than all data points for the other two methods.
### Key Observations
1. **Superior Performance of Fine-tuning:** The "Fine-tune" method (dashed line) demonstrates both the best calibration (lowest ECE ~5%) and the best discriminative performance (highest AUROC ~72%) consistently, independent of the accuracy range plotted.
2. **Calibration vs. Discrimination Trade-off:** For the Zero-Shot and Verbal methods, higher Accuracy is associated with *worse* calibration (higher ECE) but *better* discrimination (higher AUROC).
3. **Variability:** The Zero-Shot Classifier shows significantly higher variance in ECE compared to the Verbal method, suggesting less consistent calibration.
4. **Performance Clustering:** The Verbal method's data points are more tightly clustered than the Zero-Shot method's, indicating more predictable performance.
### Interpretation
This data suggests a fundamental trade-off between model calibration and raw discriminative power when using prompt-based (Zero-Shot, Verbal) methods versus a fully fine-tuned model. The fine-tuned model achieves a superior balance, excelling in both metrics.
The positive correlation between Accuracy and AUROC is expected, as both measure aspects of correct classification. However, the simultaneous positive correlation between Accuracy and ECE for the prompt-based methods is a critical finding. It indicates that as these models become more accurate on this test set, they also become more *overconfident* in their predictions (higher ECE). This is a known issue with large language models used as zero-shot classifiers.
The "Fine-tune" line acts as a gold-standard benchmark. The fact that it is horizontal implies its performance is stable and serves as a target. The gap between the dashed line and the scatter points quantifies the performance cost of using prompt-based methods instead of task-specific fine-tuning for this particular evaluation. The wider scatter of the Zero-Shot method highlights the instability and sensitivity of pure prompting compared to the more structured "Verbal" method (which may involve more engineered prompts or a specific verbalization format).