## Scatter Plots: ECE vs Accuracy and AUROC vs Accuracy
### Overview
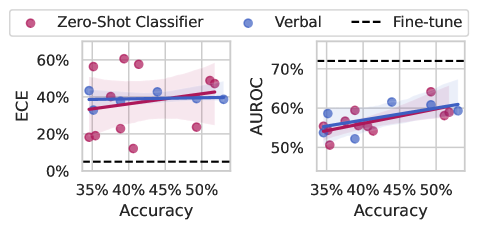
The image contains two side-by-side scatter plots comparing model performance metrics (ECE and AUROC) against accuracy. Both plots show data points for two classifier types (Zero-Shot and Verbal) with a reference line labeled "Fine-tune." The plots demonstrate relationships between accuracy and calibration (ECE) and discriminative power (AUROC).
### Components/Axes
**Left Plot (ECE vs Accuracy):**
- **X-axis**: Accuracy (35% to 50%, labeled in 5% increments)
- **Y-axis**: Expected Calibration Error (ECE, 0% to 60%)
- **Legend**:
- Pink circles: Zero-Shot Classifier
- Blue circles: Verbal
- Dashed black line: Fine-tune
- **Visual Elements**:
- Shaded pink region around Zero-Shot line (confidence interval)
- Shaded blue region around Verbal line
**Right Plot (AUROC vs Accuracy):**
- **X-axis**: Accuracy (35% to 50%, same scale as left plot)
- **Y-axis**: Area Under Receiver Operating Characteristic Curve (AUROC, 50% to 70%)
- **Legend**: Same as left plot
- **Visual Elements**:
- Shaded pink region around Zero-Shot line
- Shaded blue region around Verbal line
### Detailed Analysis
**Left Plot (ECE):**
- **Zero-Shot Classifier (pink)**:
- Data points cluster between 20-40% ECE
- Line shows slight upward trend (ECE increases with accuracy)
- Shaded region spans ~10% of ECE values
- **Verbal (blue)**:
- Data points cluster between 30-45% ECE
- Line shows stronger upward trend than Zero-Shot
- Shaded region spans ~15% of ECE values
- **Fine-tune line**: Horizontal dashed line at ~35% ECE
**Right Plot (AUROC):**
- **Zero-Shot Classifier (pink)**:
- Data points cluster between 50-60% AUROC
- Line shows moderate upward trend
- Shaded region spans ~5% of AUROC values
- **Verbal (blue)**:
- Data points cluster between 55-65% AUROC
- Line shows stronger upward trend than Zero-Shot
- Shaded region spans ~10% of AUROC values
- **Fine-tune line**: Horizontal dashed line at ~70% AUROC
### Key Observations
1. **Positive Correlation**: Both ECE and AUROC increase with accuracy in all models
2. **Verbal Advantage**: Verbal models consistently outperform Zero-Shot in both metrics at similar accuracy levels
3. **Calibration vs Discrimination**:
- Verbal models show better calibration (lower ECE) and higher AUROC
- Zero-Shot models demonstrate more variability in performance
4. **Fine-tune Thresholds**:
- ECE target: ~35% (dashed line)
- AUROC target: ~70% (dashed line)
5. **Shaded Regions**: Indicate measurement uncertainty, with Verbal showing greater variability
### Interpretation
The data suggests that Verbal models achieve better performance across both calibration and discrimination metrics compared to Zero-Shot models at equivalent accuracy levels. The upward trends indicate that higher accuracy generally improves both calibration and discriminative power. However, the shaded regions reveal that individual model performance varies significantly, particularly for Verbal models which show wider confidence intervals. The Fine-tune reference lines establish clear performance benchmarks, with Verbal models approaching or exceeding these targets in both metrics. The consistent outperformance of Verbal models suggests architectural or training advantages over Zero-Shot approaches in this evaluation framework.