## Chart: Attack Success Rate (ASR) vs. Attack Ratio for Federated Learning Defenses
### Overview
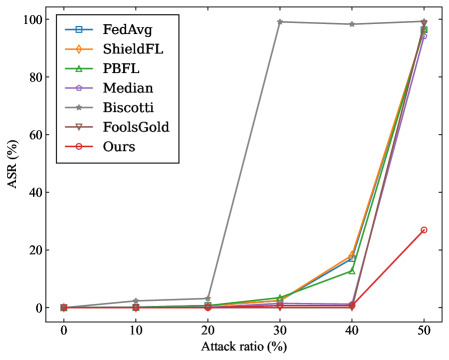
The image presents a line chart comparing the Attack Success Rate (ASR) of different Federated Learning (FL) defense mechanisms against varying Attack Ratios. The chart visualizes how effectively each defense strategy mitigates attacks as the proportion of malicious participants increases.
### Components/Axes
* **X-axis:** "Attack ratio (%)" - Ranges from 0% to 50%, with markers at 0, 10, 20, 30, 40, and 50.
* **Y-axis:** "ASR (%)" - Ranges from 0% to 100%, with markers at 0, 20, 40, 60, 80, and 100.
* **Legend (Top-Left):** Lists the different defense mechanisms being compared:
* FedAvg (Blue, dashed line with square markers)
* ShieldFL (Orange, dashed line with circle markers)
* PBFL (Green, dashed line with triangle markers)
* Median (Gray, solid line with diamond markers)
* Biscotti (Black, solid line with asterisk markers)
* FoolsGold (Brown, dashed line with plus markers)
* Ours (Red, solid line with circle markers)
### Detailed Analysis
Here's a breakdown of each line's trend and approximate data points, cross-referencing with the legend colors:
* **FedAvg (Blue):** Starts at approximately 0% ASR at 0% attack ratio. Remains at 0% until approximately 20% attack ratio, then rises sharply to approximately 95% ASR at 50% attack ratio.
* **ShieldFL (Orange):** Starts at approximately 0% ASR at 0% attack ratio. Remains at 0% until approximately 30% attack ratio, then increases to approximately 15% ASR at 40% attack ratio, and reaches approximately 95% ASR at 50% attack ratio.
* **PBFL (Green):** Starts at approximately 0% ASR at 0% attack ratio. Remains at 0% until approximately 30% attack ratio, then increases to approximately 15% ASR at 40% attack ratio, and reaches approximately 95% ASR at 50% attack ratio.
* **Median (Gray):** Starts at approximately 0% ASR at 0% attack ratio. Remains at 0% until approximately 20% attack ratio, then rises sharply to approximately 95% ASR at 50% attack ratio.
* **Biscotti (Black):** Starts at approximately 0% ASR at 0% attack ratio. Remains at 0% until approximately 20% attack ratio, then rises sharply to approximately 95% ASR at 50% attack ratio.
* **FoolsGold (Brown):** Starts at approximately 0% ASR at 0% attack ratio. Remains at 0% until approximately 40% attack ratio, then increases to approximately 5% ASR at 50% attack ratio.
* **Ours (Red):** Starts at approximately 0% ASR at 0% attack ratio. Remains at 0% until approximately 30% attack ratio, then increases to approximately 10% ASR at 40% attack ratio, and reaches approximately 25% ASR at 50% attack ratio.
### Key Observations
* Most defense mechanisms (FedAvg, ShieldFL, PBFL, Median, Biscotti) exhibit a sharp increase in ASR after approximately 20-30% attack ratio, indicating a vulnerability to attacks when a significant portion of participants are malicious.
* FoolsGold demonstrates the most resilience, maintaining a very low ASR even at a 50% attack ratio.
* The proposed defense ("Ours") consistently shows a lower ASR compared to other defenses, especially at higher attack ratios, suggesting improved robustness.
* ShieldFL and PBFL have identical curves.
### Interpretation
The chart demonstrates the effectiveness of different Federated Learning defense mechanisms against adversarial attacks. The ASR represents the probability of a successful attack, and the Attack Ratio represents the proportion of malicious participants in the FL system.
The sharp increase in ASR for most defenses at higher attack ratios suggests that these defenses are susceptible to collusion or coordinated attacks when a substantial number of participants are compromised. FoolsGold appears to be the most robust defense, likely due to its specific design principles. The proposed defense ("Ours") shows promising results, offering a lower ASR across the tested attack ratios, indicating a potential improvement in the security of Federated Learning systems.
The identical curves for ShieldFL and PBFL suggest that these two defenses are either functionally equivalent or share a common underlying mechanism. Further investigation would be needed to determine the exact relationship between them. The chart highlights the importance of developing robust defense mechanisms that can withstand attacks even in scenarios with a high proportion of malicious participants.