\n
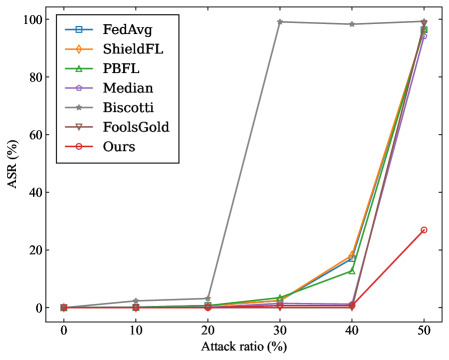
## Line Chart: Attack Success Rate (ASR) vs. Attack Ratio
### Overview
This is a line chart comparing the performance of seven different methods (likely federated learning aggregation or defense algorithms) against a poisoning attack. The chart plots the Attack Success Rate (ASR) as a percentage against the Attack Ratio (the proportion of malicious clients or poisoned data) as a percentage. The data suggests an evaluation of algorithmic robustness.
### Components/Axes
* **Chart Type:** Multi-line chart with markers.
* **X-Axis:** Labeled "Attack ratio (%)". Scale ranges from 0 to 50, with major tick marks at 0, 10, 20, 30, 40, and 50.
* **Y-Axis:** Labeled "ASR (%)". Scale ranges from 0 to 100, with major tick marks at 0, 20, 40, 60, 80, and 100.
* **Legend:** Located in the top-left corner of the plot area. It lists seven data series with corresponding colors and markers:
1. **FedAvg:** Blue line with square markers (□).
2. **ShieldFL:** Orange line with diamond markers (◇).
3. **PBFL:** Green line with upward-pointing triangle markers (△).
4. **Median:** Purple line with circle markers (○).
5. **Biscotti:** Gray line with star/asterisk markers (☆).
6. **FoolsGold:** Brown line with downward-pointing triangle markers (▽).
7. **Ours:** Red line with circle markers (○).
### Detailed Analysis
The chart tracks the ASR for each method at six discrete attack ratios: 0%, 10%, 20%, 30%, 40%, and 50%.
**Trend Verification & Data Points (Approximate):**
1. **Biscotti (Gray, ☆):** This line shows a dramatically different trend. It remains near 0% ASR at 0%, 10%, and 20% attack ratio. It then experiences a **sharp, near-vertical increase** between 20% and 30%, reaching approximately **98-99% ASR** at 30%. It plateaus at this very high level (~98-99%) for attack ratios of 40% and 50%. This is a clear outlier in behavior.
2. **FedAvg (Blue, □), ShieldFL (Orange, ◇), PBFL (Green, △), FoolsGold (Brown, ▽):** These four methods follow a very similar pattern. They all maintain a very low ASR (approximately 0-5%) from 0% up to a 40% attack ratio. Between 40% and 50%, they all exhibit a **steep, simultaneous increase**, converging to a high ASR in the range of **~92-98%** at the 50% attack ratio point. Their lines are tightly clustered, especially at the 50% mark.
3. **Median (Purple, ○):** This method follows a trend similar to the group above but with a slightly less severe final increase. It stays near 0-5% ASR until 40% attack ratio. At 50%, it rises to approximately **~90% ASR**, which is slightly lower than the FedAvg/ShieldFL/PBFL/FoolsGold cluster.
4. **Ours (Red, ○):** This method demonstrates the most robust performance. It maintains an ASR near 0% from 0% to 40% attack ratio. At the 50% attack ratio, it shows a **moderate increase** to approximately **~25% ASR**. This is significantly lower than all other methods at the highest tested attack ratio.
**Spatial Grounding:** The legend is positioned in the top-left quadrant, overlapping slightly with the upper part of the Biscotti line's plateau. The data points for all series at 0%, 10%, and 20% are clustered very closely near the bottom of the chart (0-5% ASR). The most significant visual separation occurs at the 30% mark (where Biscotti diverges) and the 50% mark (where "Ours" separates from the high-ASR cluster).
### Key Observations
1. **Critical Threshold:** For six of the seven methods (all except Biscotti), there appears to be a critical threshold between 40% and 50% attack ratio where their defense collapses, leading to a dramatic spike in ASR.
2. **Biscotti's Early Failure:** The Biscotti method fails at a much lower attack ratio (30%) compared to the others, but its ASR saturates near 100% immediately.
3. **"Ours" Outperforms:** The method labeled "Ours" is the only one that maintains a relatively low ASR (~25%) even at the highest tested attack ratio of 50%, indicating superior resilience.
4. **Clustering of Baselines:** FedAvg, ShieldFL, PBFL, and FoolsGold perform almost identically across the entire range, suggesting similar vulnerability profiles under this specific attack scenario.
### Interpretation
This chart is likely from a research paper evaluating a new federated learning defense mechanism ("Ours") against poisoning attacks. The data demonstrates that the proposed method ("Ours") significantly outperforms several established baselines (FedAvg, ShieldFL, PBFL, Median, FoolsGold) and one other method (Biscotti) in terms of maintaining a low Attack Success Rate as the proportion of malicious participants increases.
The key finding is that while most traditional aggregation methods (like FedAvg, Median) and some defenses (ShieldFL, PBFL, FoolsGold) are effective up to a 40% attack ratio, they become highly vulnerable at 50%. Biscotti appears to be vulnerable at even lower attack ratios (30%). The proposed "Ours" method shows a much more gradual and limited increase in ASR, suggesting it incorporates a more robust mechanism for identifying and mitigating the influence of poisoned updates, even when they constitute half of the total updates. The chart effectively argues for the practical superiority of the "Ours" method in high-threat environments.