## Line Graph: Attack Success Rate (ASR) vs. Attack Ratio (%)
### Overview
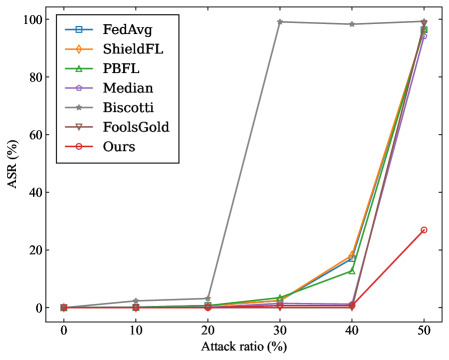
The graph compares the Attack Success Rate (ASR) of seven different methods across varying attack ratios (0% to 50%). ASR is plotted on the y-axis (0–100%), while the x-axis represents the attack ratio percentage. The legend identifies methods by color and marker, with "Ours" (red circles) and "FoolsGold" (brown triangles) showing distinct performance patterns.
### Components/Axes
- **X-axis**: Attack ratio (%) ranging from 0 to 50.
- **Y-axis**: Attack Success Rate (ASR) (%) ranging from 0 to 100.
- **Legend**: Located in the top-left corner, associating colors/markers with methods:
- FedAvg (blue squares)
- ShieldFL (orange diamonds)
- PBFL (green triangles)
- Median (purple pentagons)
- Biscotti (gray stars)
- FoolsGold (brown triangles)
- Ours (red circles)
### Detailed Analysis
1. **Biscotti (gray stars)**:
- Starts near 0% ASR at 0% attack ratio.
- Sharp upward spike at 30% attack ratio, reaching ~100% ASR.
- Maintains ~100% ASR until 50% attack ratio.
2. **FoolsGold (brown triangles)**:
- Remains near 0% ASR until 40% attack ratio.
- Steep rise at 40%, reaching ~100% ASR by 50% attack ratio.
3. **Ours (red circles)**:
- Stays near 0% ASR until 40% attack ratio.
- Sharp increase at 50%, reaching ~25% ASR.
4. **FedAvg (blue squares)**:
- Gradual rise from 0% to ~15% ASR at 50% attack ratio.
5. **ShieldFL (orange diamonds)**:
- Gradual rise from 0% to ~20% ASR at 50% attack ratio.
6. **PBFL (green triangles)**:
- Gradual rise from 0% to ~10% ASR at 50% attack ratio.
7. **Median (purple pentagons)**:
- Gradual rise from 0% to ~5% ASR at 50% attack ratio.
### Key Observations
- **Biscotti** and **FoolsGold** exhibit the highest ASR at 50% attack ratio (~100%), with abrupt performance jumps at 30% and 40% attack ratios, respectively.
- **Ours** shows the steepest late-stage increase but lags behind Biscotti and FoolsGold at 50% attack ratio.
- Methods like FedAvg, ShieldFL, and PBFL demonstrate gradual, linear improvements, peaking at ~15–20% ASR at 50% attack ratio.
- All methods maintain near-0% ASR until attack ratios exceed 30%.
### Interpretation
The graph highlights a threshold effect in ASR performance: Biscotti and FoolsGold achieve near-perfect success rates only after attack ratios surpass 30% and 40%, respectively. This suggests these methods are highly resilient but may underperform at lower attack ratios. "Ours" demonstrates competitive late-stage performance but requires a 50% attack ratio to activate. Gradual improvements in FedAvg, ShieldFL, and PBFL imply incremental robustness, though they lack the dramatic efficiency of Biscotti and FoolsGold. The data underscores a trade-off between attack ratio tolerance and ASR efficiency, with Biscotti and FoolsGold excelling in high-threat scenarios.