## Line Chart: Length Reduction vs. Threshold
### Overview
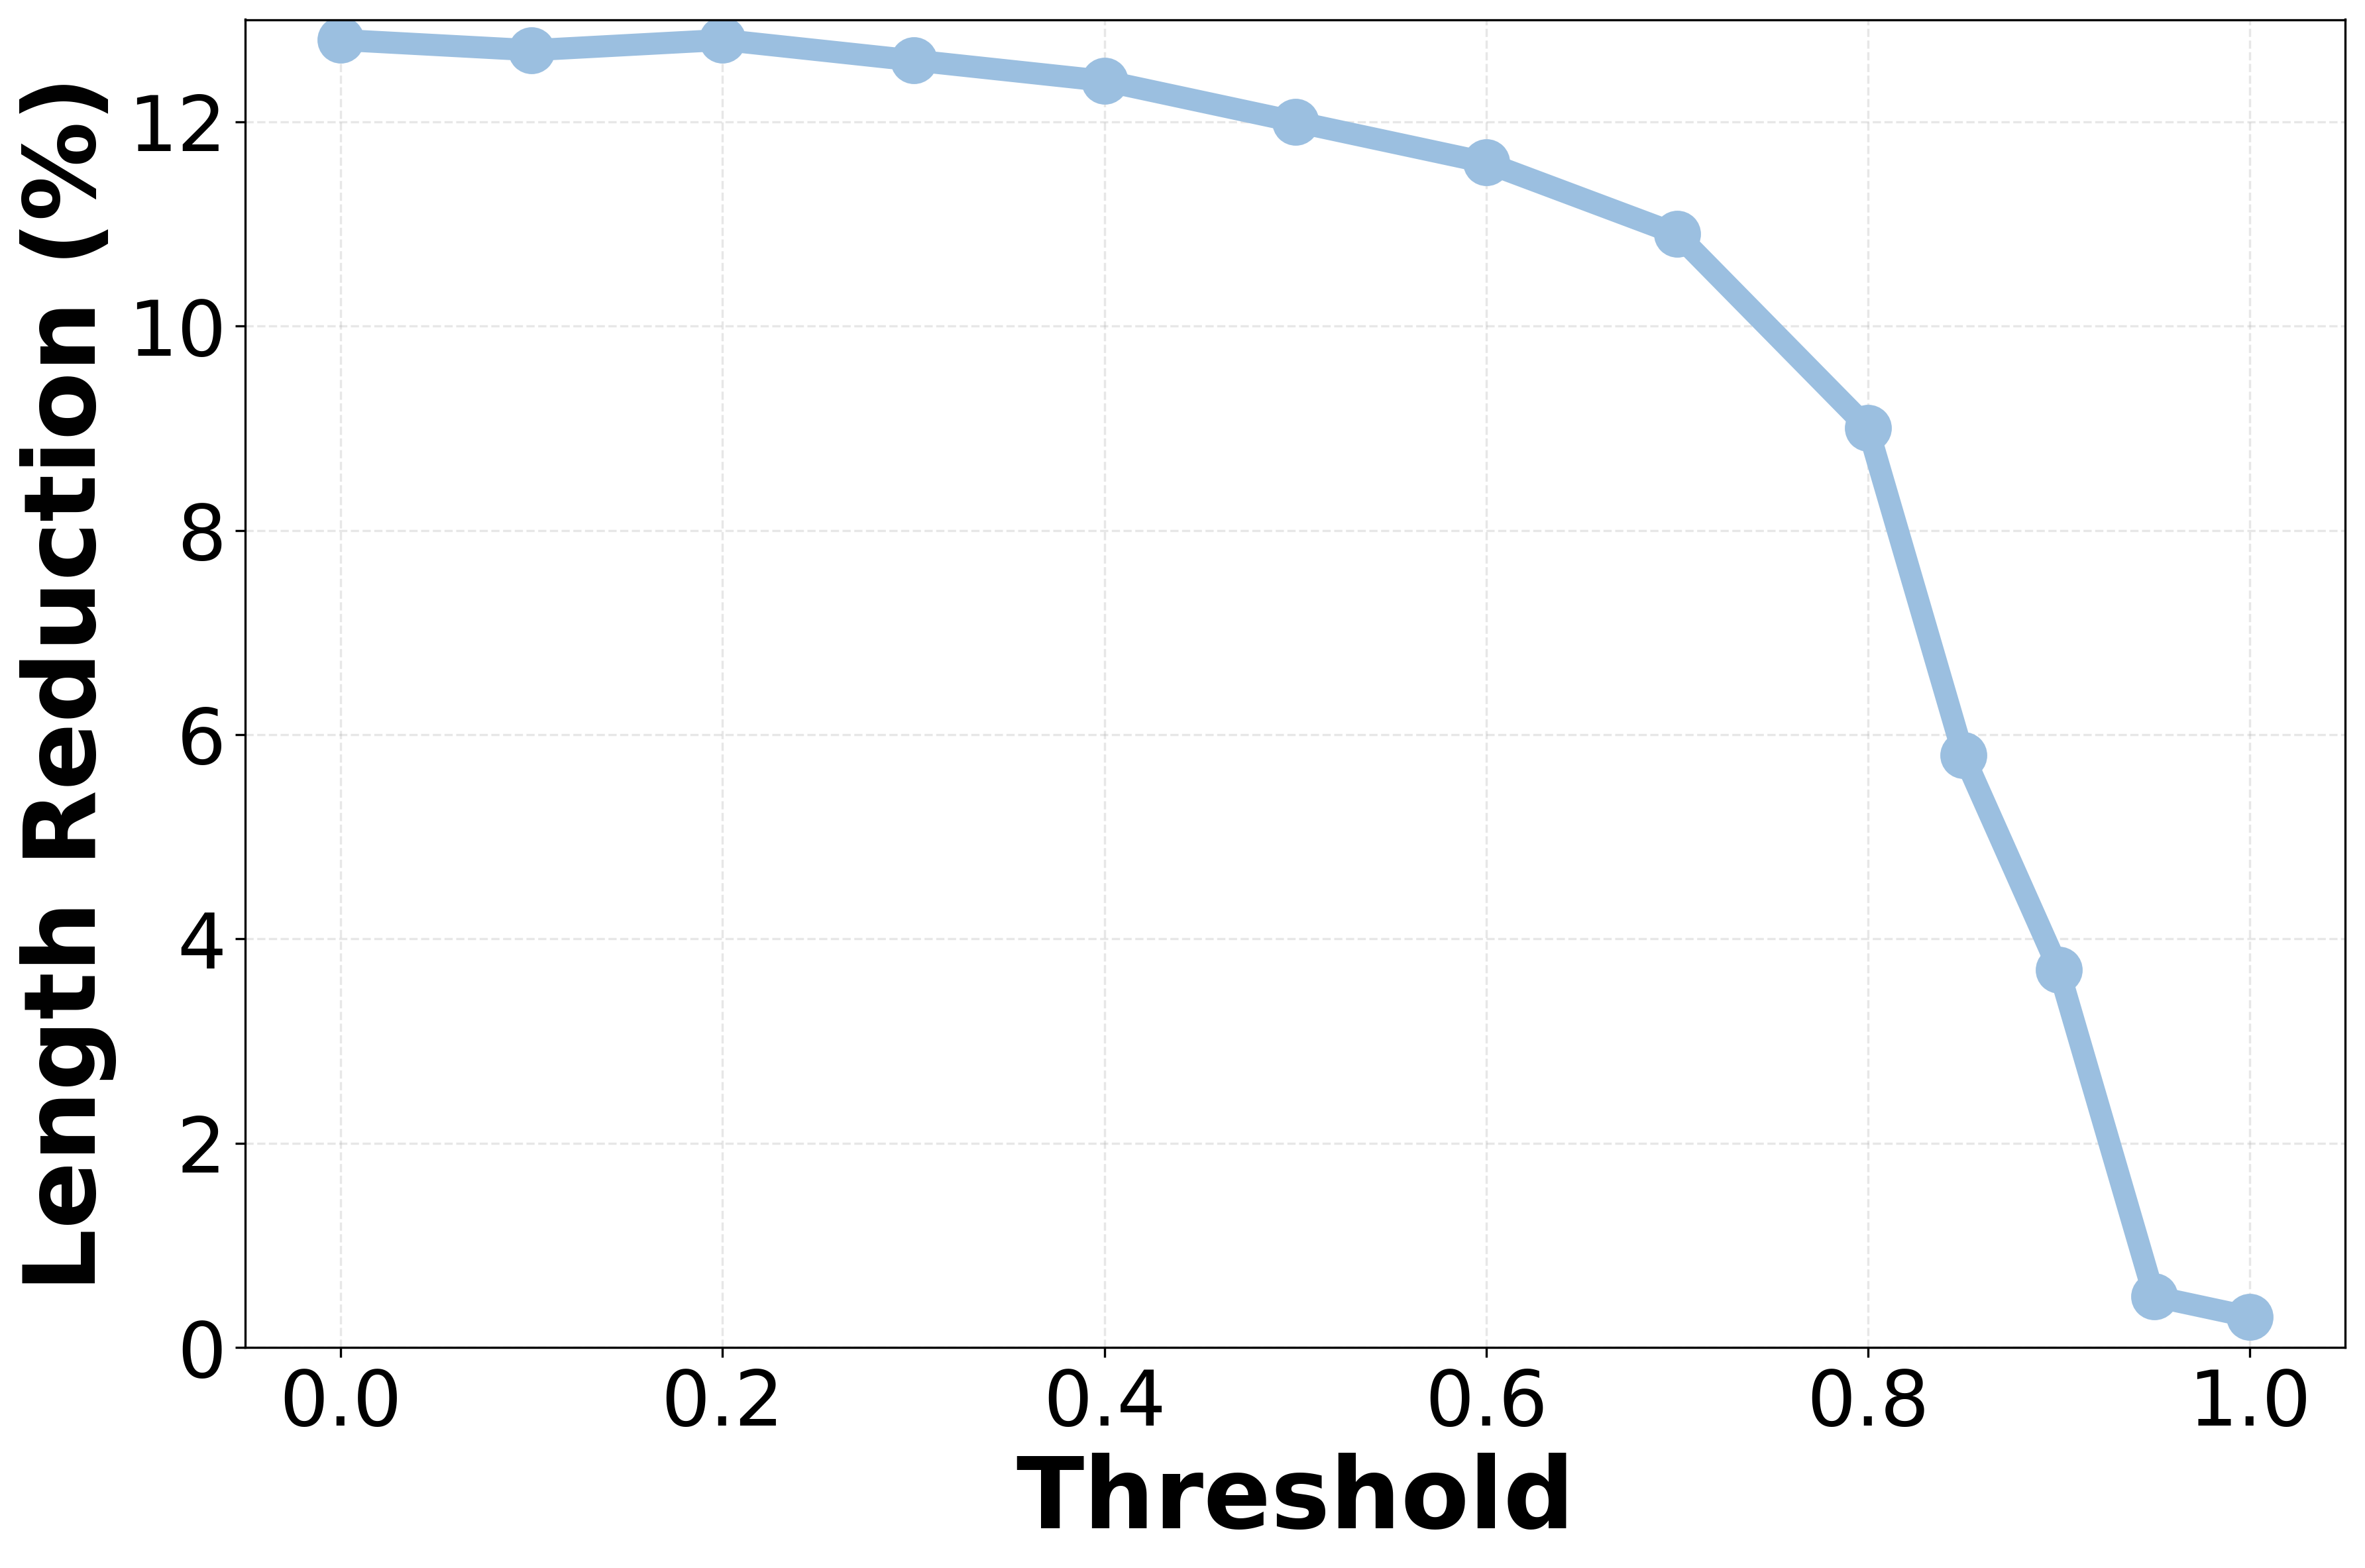
The image is a line chart showing the relationship between "Threshold" (x-axis) and "Length Reduction (%)" (y-axis). The chart displays how the length reduction changes as the threshold increases. The line is light blue and has circular markers at each data point. The background has a faint grid.
### Components/Axes
* **X-axis:** "Threshold" with values ranging from 0.0 to 1.0 in increments of 0.2.
* **Y-axis:** "Length Reduction (%)" with values ranging from 0 to 12 in increments of 2.
* **Data Series:** A single light blue line representing the length reduction at different threshold values.
### Detailed Analysis
The light blue line shows the following approximate data points:
* **Threshold 0.0:** Length Reduction ~12.8%
* **Threshold 0.1:** Length Reduction ~12.7%
* **Threshold 0.2:** Length Reduction ~12.8%
* **Threshold 0.3:** Length Reduction ~12.6%
* **Threshold 0.4:** Length Reduction ~12.3%
* **Threshold 0.5:** Length Reduction ~12.0%
* **Threshold 0.6:** Length Reduction ~11.5%
* **Threshold 0.7:** Length Reduction ~10.9%
* **Threshold 0.8:** Length Reduction ~9.0%
* **Threshold 0.85:** Length Reduction ~5.8%
* **Threshold 0.9:** Length Reduction ~3.7%
* **Threshold 0.95:** Length Reduction ~0.5%
* **Threshold 1.0:** Length Reduction ~0.3%
The line is relatively flat from a threshold of 0.0 to 0.6, indicating a stable length reduction. After a threshold of 0.6, the line begins to slope downward, indicating a decreasing length reduction as the threshold increases. The most significant drop occurs between thresholds of 0.8 and 0.9.
### Key Observations
* The length reduction is relatively constant at higher values (around 12-13%) for threshold values between 0.0 and 0.6.
* There is a sharp decline in length reduction as the threshold increases from 0.7 to 1.0.
* The length reduction approaches zero as the threshold approaches 1.0.
### Interpretation
The chart suggests that increasing the threshold beyond a certain point (around 0.6) significantly reduces the length reduction. This implies that there is an optimal threshold value below 0.6 that maximizes the length reduction. The sharp decline indicates that higher threshold values are detrimental to achieving significant length reduction. The data demonstrates an inverse relationship between the threshold and length reduction beyond a certain threshold value.