\n
## Line Chart: Length Reduction vs. Threshold
### Overview
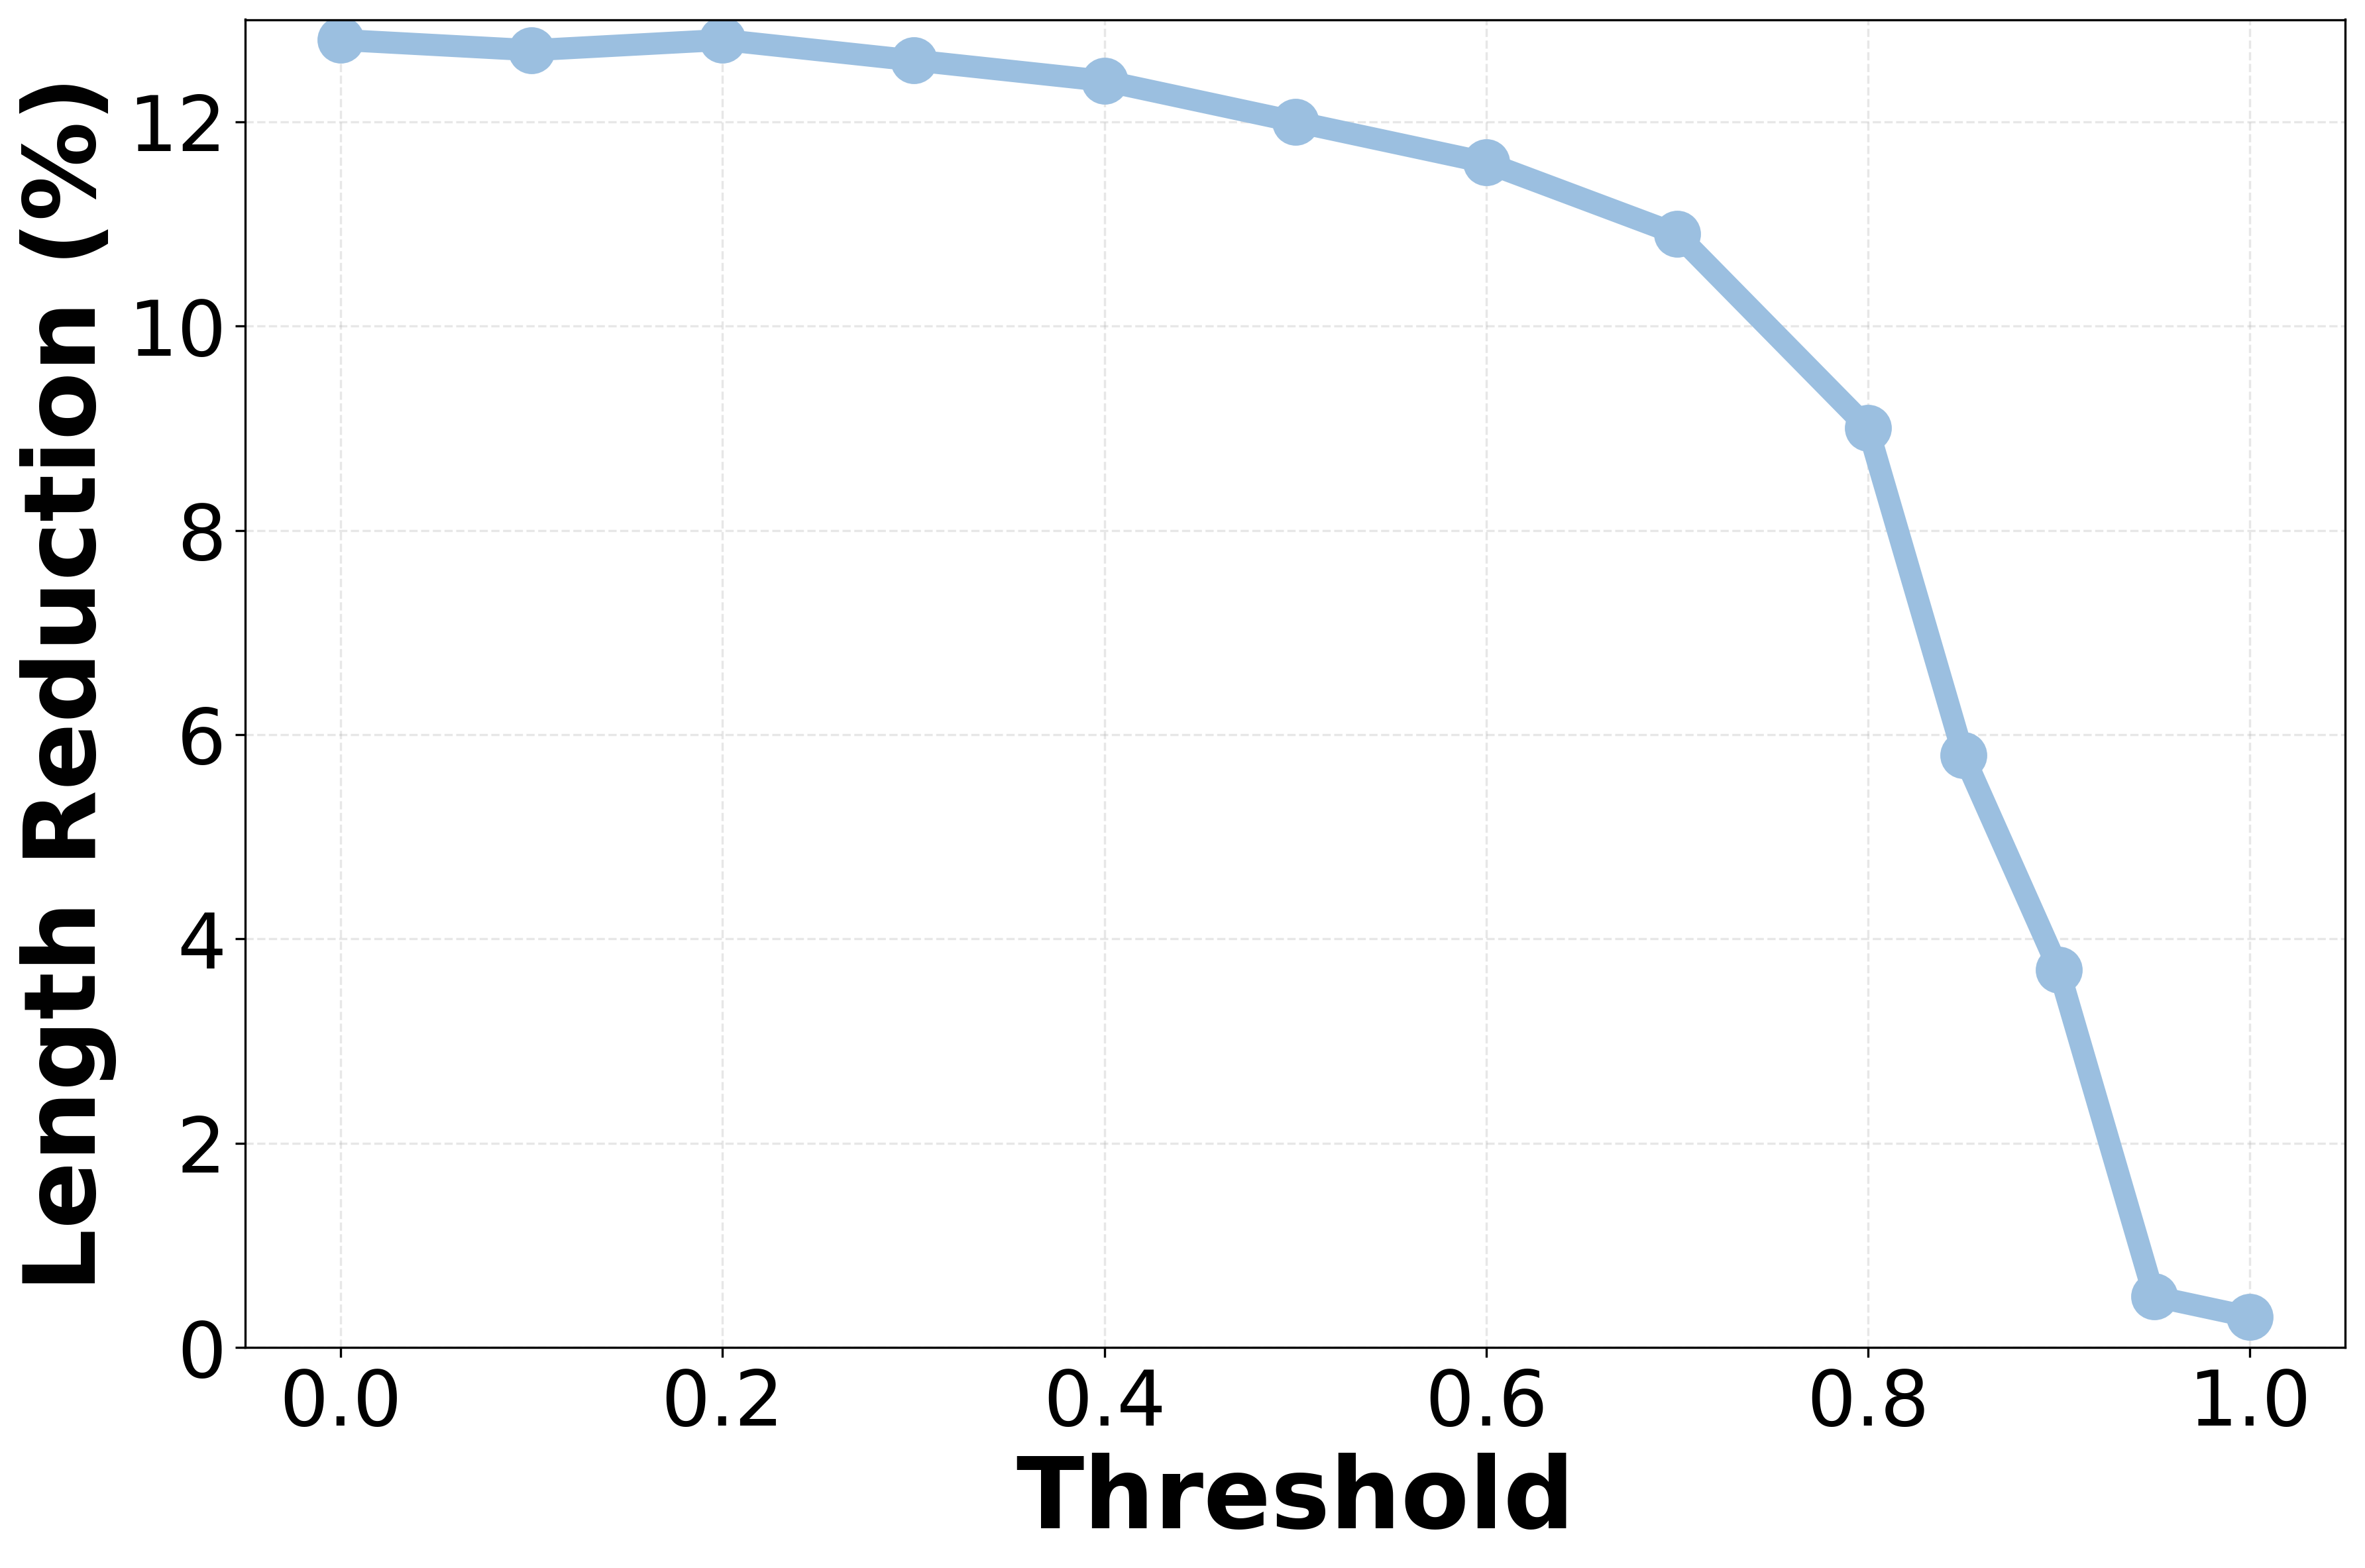
The image presents a line chart illustrating the relationship between a "Threshold" value (on the x-axis) and "Length Reduction" (expressed as a percentage, on the y-axis). The chart shows how the percentage of length reduction changes as the threshold is varied from 0.0 to 1.0.
### Components/Axes
* **X-axis:** Labeled "Threshold". Scale ranges from 0.0 to 1.0, with markers at 0.0, 0.2, 0.4, 0.6, 0.8, and 1.0.
* **Y-axis:** Labeled "Length Reduction (%)". Scale ranges from 0.0 to 13.0%, with markers at 0, 2, 4, 6, 8, 10, 12.
* **Data Series:** A single line, colored light blue, representing the length reduction percentage.
* **Grid:** A light gray grid is present in the background, aiding in reading values.
### Detailed Analysis
The line representing length reduction starts at approximately 12.7% at a threshold of 0.0. It remains relatively stable, fluctuating slightly around 12.5% until a threshold of approximately 0.6. From 0.6 onwards, the line begins to descend more steeply. At a threshold of 0.8, the length reduction is approximately 9.2%. Finally, at a threshold of 1.0, the length reduction drops to approximately 0.2%.
Here's a breakdown of approximate data points:
* Threshold = 0.0, Length Reduction = 12.7% (±0.2%)
* Threshold = 0.2, Length Reduction = 12.5% (±0.2%)
* Threshold = 0.4, Length Reduction = 12.4% (±0.2%)
* Threshold = 0.6, Length Reduction = 12.1% (±0.2%)
* Threshold = 0.8, Length Reduction = 9.2% (±0.2%)
* Threshold = 1.0, Length Reduction = 0.2% (±0.1%)
The line exhibits a relatively flat trend between thresholds 0.0 and 0.6, indicating minimal change in length reduction. Beyond 0.6, the trend becomes strongly negative, signifying a rapid decrease in length reduction as the threshold increases.
### Key Observations
* The length reduction is relatively insensitive to changes in the threshold for values between 0.0 and 0.6.
* A significant drop in length reduction occurs when the threshold exceeds 0.6.
* The length reduction approaches zero as the threshold approaches 1.0.
### Interpretation
This chart likely represents the effect of a threshold parameter on a length reduction process. The threshold could be a parameter controlling the degree of simplification or compression applied to some data or structure.
The initial flat portion of the curve suggests that small changes in the threshold have little impact on the length reduction. However, once the threshold reaches a certain point (around 0.6), increasing it further leads to a substantial decrease in the length reduction. This could indicate that beyond this threshold, the process begins to remove essential information or components, resulting in a less effective reduction.
The rapid decline towards zero length reduction at a threshold of 1.0 suggests that setting the threshold too high effectively disables the length reduction process. This could be due to the removal of too much information, rendering the reduction ineffective.
The chart suggests an optimal threshold range exists between 0.0 and 0.6, where length reduction is maximized without significantly compromising the integrity of the underlying data or structure. Further investigation would be needed to understand the specific context and determine the appropriate threshold value for a given application.