\n
## Line Chart: I-Don't-Know Rate vs. Layer for Llama Models
### Overview
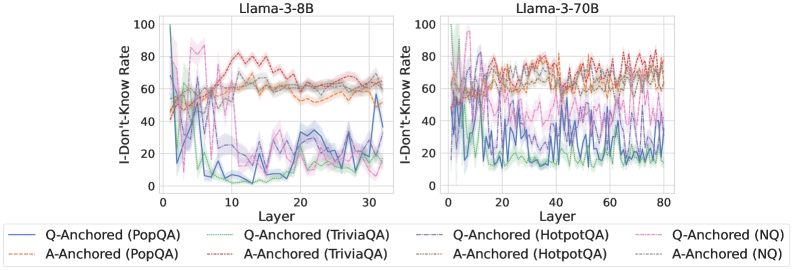
The image presents two line charts, side-by-side, displaying the "I-Don't-Know Rate" against the "Layer" number for two different Llama models: Llama-3-8B and Llama-3-70B. Each chart features multiple lines representing different data series, distinguished by color and annotation. The charts aim to visualize how the rate of uncertainty (indicated by "I-Don't-Know") changes across the layers of these language models.
### Components/Axes
* **X-axis:** "Layer" - Ranges from 0 to approximately 30 for Llama-3-8B and 0 to approximately 80 for Llama-3-70B.
* **Y-axis:** "I-Don't-Know Rate" - Ranges from 0 to 100.
* **Title (Left Chart):** "Llama-3-8B"
* **Title (Right Chart):** "Llama-3-70B"
* **Legend (Bottom):** Contains the following data series labels:
* Q-Anchored (PopQA) - Blue line
* A-Anchored (PopQA) - Orange dotted line
* Q-Anchored (TriviaQA) - Green line
* A-Anchored (TriviaQA) - Red dotted line
* Q-Anchored (HotpotQA) - Purple dashed line
* A-Anchored (HotpotQA) - Brown dotted line
* Q-Anchored (NQ) - Teal line
* A-Anchored (NQ) - Pink dotted line
### Detailed Analysis or Content Details
**Llama-3-8B Chart:**
* **Q-Anchored (PopQA):** Starts at approximately 20, dips to around 10 at layer 5, then fluctuates between 20 and 40, ending around 30.
* **A-Anchored (PopQA):** Starts at approximately 70, decreases to around 50 by layer 5, then stabilizes between 50 and 70, ending around 60.
* **Q-Anchored (TriviaQA):** Starts at approximately 30, dips to around 15 at layer 5, then fluctuates between 20 and 40, ending around 35.
* **A-Anchored (TriviaQA):** Starts at approximately 80, decreases to around 60 by layer 5, then stabilizes between 60 and 80, ending around 70.
* **Q-Anchored (HotpotQA):** Starts at approximately 60, dips to around 30 at layer 5, then fluctuates between 30 and 60, ending around 50.
* **A-Anchored (HotpotQA):** Starts at approximately 80, decreases to around 60 by layer 5, then stabilizes between 60 and 80, ending around 70.
* **Q-Anchored (NQ):** Starts at approximately 10, remains relatively low, fluctuating between 10 and 30, ending around 20.
* **A-Anchored (NQ):** Starts at approximately 70, decreases to around 50 by layer 5, then stabilizes between 50 and 70, ending around 60.
**Llama-3-70B Chart:**
* **Q-Anchored (PopQA):** Starts at approximately 20, fluctuates significantly between 20 and 60, ending around 40.
* **A-Anchored (PopQA):** Starts at approximately 70, fluctuates significantly between 60 and 80, ending around 70.
* **Q-Anchored (TriviaQA):** Starts at approximately 30, fluctuates significantly between 20 and 60, ending around 40.
* **A-Anchored (TriviaQA):** Starts at approximately 80, fluctuates significantly between 70 and 90, ending around 80.
* **Q-Anchored (HotpotQA):** Starts at approximately 60, fluctuates significantly between 40 and 80, ending around 60.
* **A-Anchored (HotpotQA):** Starts at approximately 80, fluctuates significantly between 70 and 90, ending around 80.
* **Q-Anchored (NQ):** Starts at approximately 10, fluctuates significantly between 10 and 40, ending around 20.
* **A-Anchored (NQ):** Starts at approximately 70, fluctuates significantly between 60 and 80, ending around 70.
### Key Observations
* In both charts, the "A-Anchored" series consistently exhibit higher "I-Don't-Know Rates" than the corresponding "Q-Anchored" series.
* The "I-Don't-Know Rate" generally decreases in the initial layers (0-5) for most series, then tends to stabilize or fluctuate.
* The Llama-3-70B model shows more pronounced fluctuations in the "I-Don't-Know Rate" across layers compared to the Llama-3-8B model.
* The NQ dataset consistently shows the lowest "I-Don't-Know Rate" among the "Q-Anchored" series.
### Interpretation
The charts illustrate the uncertainty levels of the Llama-3 models across different layers, assessed using various question-answering datasets (PopQA, TriviaQA, HotpotQA, and NQ). The higher "I-Don't-Know Rate" for "A-Anchored" series suggests that the models are more uncertain when answering questions based on the answer itself (A-Anchored) compared to questions based on the question itself (Q-Anchored). This could indicate that the models struggle more with reasoning about the answer context.
The decrease in "I-Don't-Know Rate" in the initial layers suggests that the models learn basic patterns and knowledge in the early layers. The subsequent stabilization or fluctuation indicates that further layers refine this knowledge but don't necessarily lead to a significant reduction in uncertainty.
The greater fluctuations in the Llama-3-70B model might be due to its larger size and increased complexity, allowing it to capture more nuanced patterns but also making it more susceptible to variations in the input data. The consistently low "I-Don't-Know Rate" for the NQ dataset suggests that the model performs relatively well on this particular type of question-answering task.
These findings provide insights into the strengths and weaknesses of the Llama-3 models and can inform future research on improving their reasoning capabilities and reducing their uncertainty levels.