TECHNICAL ASSET FINGERPRINT
62d8654efebd9826b4a86f69
Click to view fullscreen
Press ESC or click to close
FOUND IN PAPERS
EXPERT: healer-alpha-free VERSION 1
RUNTIME: free/openrouter/healer-alpha
INTEL_VERIFIED
## Line Charts: I-Don't-Know Rate Across Model Layers
### Overview
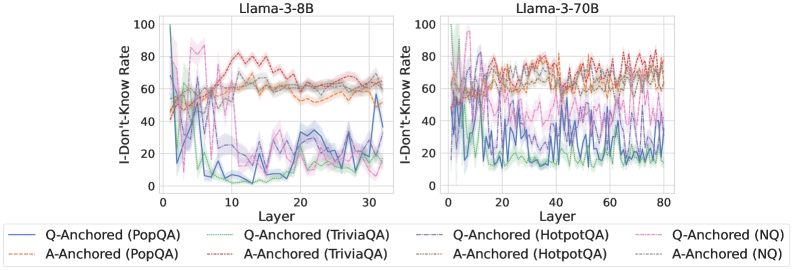
The image displays two side-by-side line charts comparing the "I-Don't-Know Rate" across the layers of two different Large Language Models: Llama-3-8B (left) and Llama-3-70B (right). Each chart plots the performance of eight different experimental conditions, defined by an anchoring method (Q-Anchored or A-Anchored) applied to four different question-answering datasets (PopQA, TriviaQA, HotpotQA, NQ).
### Components/Axes
* **Chart Titles:**
* Left Chart: `Llama-3-8B`
* Right Chart: `Llama-3-70B`
* **Y-Axis (Both Charts):**
* Label: `I-Don't-Know Rate`
* Scale: 0 to 100, with major tick marks at 0, 20, 40, 60, 80, 100.
* **X-Axis (Both Charts):**
* Label: `Layer`
* Scale (Llama-3-8B): 0 to 30, with major tick marks at 0, 10, 20, 30.
* Scale (Llama-3-70B): 0 to 80, with major tick marks at 0, 20, 40, 60, 80.
* **Legend (Bottom, spanning both charts):**
* The legend is positioned below the two charts and defines eight distinct lines using a combination of color and line style (solid vs. dashed).
* **Q-Anchored (Solid Lines):**
* Blue solid line: `Q-Anchored (PopQA)`
* Green solid line: `Q-Anchored (TriviaQA)`
* Purple solid line: `Q-Anchored (HotpotQA)`
* Pink solid line: `Q-Anchored (NQ)`
* **A-Anchored (Dashed Lines):**
* Orange dashed line: `A-Anchored (PopQA)`
* Red dashed line: `A-Anchored (TriviaQA)`
* Brown dashed line: `A-Anchored (HotpotQA)`
* Gray dashed line: `A-Anchored (NQ)`
### Detailed Analysis
**Llama-3-8B Chart (Left):**
* **Q-Anchored Lines (Solid):** All four solid lines exhibit a similar, pronounced downward trend. They start at a high I-Don't-Know Rate (between ~60 and ~100) in the earliest layers (Layer 0-5). They then drop sharply, reaching their lowest points (between ~0 and ~30) in the middle layers (approximately Layers 10-20). In the final layers (25-30), they show a slight upward rebound.
* *Trend Verification:* The blue (PopQA) and green (TriviaQA) lines show the most dramatic drop, falling below 10 in the middle layers. The purple (HotpotQA) and pink (NQ) lines follow the same pattern but remain slightly higher.
* **A-Anchored Lines (Dashed):** All four dashed lines show a general upward trend, the inverse of the Q-Anchored lines. They start at a moderate rate (between ~20 and ~50) in the early layers. They rise steadily, peaking in the middle-to-late layers (approximately Layers 15-25) at values between ~60 and ~80. They then plateau or slightly decline towards the final layer.
* *Trend Verification:* The orange (PopQA) and red (TriviaQA) dashed lines reach the highest peaks, near 80. The brown (HotpotQA) and gray (NQ) lines follow a similar shape but peak at lower values (~60-70).
**Llama-3-70B Chart (Right):**
* **General Observation:** The lines in this chart are significantly more volatile and "noisy" compared to the smoother trends in the 8B model. The overall patterns are similar but less cleanly defined.
* **Q-Anchored Lines (Solid):** They still show a general downward trend from early to middle layers, but with much larger fluctuations. The initial values are high (~60-100), and they reach their approximate minima in the middle layers (around Layers 30-50), though the values bounce considerably (e.g., between ~10 and ~40). The final layers show high volatility without a clear, uniform rebound.
* **A-Anchored Lines (Dashed):** They exhibit a general upward trend with high volatility. Starting from moderate values (~30-60), they rise to reach a broad, noisy plateau in the middle-to-late layers (approximately Layers 40-70), with values fluctuating mostly between ~60 and ~85. There is no clear decline in the final layers.
### Key Observations
1. **Inverse Relationship:** There is a clear inverse relationship between the Q-Anchored and A-Anchored conditions across layers in both models. As one set of lines decreases, the other increases.
2. **Model Size Effect:** The larger model (Llama-3-70B) displays much higher variance and noise in its I-Don't-Know Rate across layers compared to the smaller, smoother model (Llama-3-8B).
3. **Dataset Variation:** While the overall trend is consistent for all datasets within an anchoring method, there are consistent offsets. For example, PopQA (blue/orange) and TriviaQA (green/red) often show more extreme values (higher highs and lower lows) than HotpotQA (purple/brown) and NQ (pink/gray).
4. **Layer Sensitivity:** The "crossover point" where the A-Anchored rate surpasses the Q-Anchored rate occurs in the early layers (around Layer 5-10) for both models.
### Interpretation
This data suggests a fundamental difference in how the model's internal representations process uncertainty based on the anchoring prompt. The "I-Don't-Know Rate" is not a static property but evolves dramatically through the network's layers.
* **Q-Anchored (Question-Anchored):** When prompted with the question, the model's early layers express high uncertainty ("I-Don't-Know"). This uncertainty is rapidly resolved in the middle layers, suggesting this is where the core reasoning or retrieval from parametric knowledge occurs. The slight rise in later layers for the 8B model might indicate a final "sanity check" or calibration step.
* **A-Anchored (Answer-Anchored):** When prompted with a potential answer, the model starts with lower uncertainty. The increasing rate through the layers suggests the model is progressively *finding reasons to doubt* the provided answer, with peak skepticism in the middle-to-late layers. This could reflect a process of verification against internal knowledge.
* **Model Scale:** The increased noise in the 70B model's signal might indicate a more complex, distributed, or less linear processing of uncertainty across its many more layers. The core inverse pattern remains, but the path is less deterministic.
* **Peircean Insight:** The charts reveal that the model's expression of ignorance is a *process*, not an output. The anchoring method essentially sets the initial hypothesis (high uncertainty for a question, lower uncertainty for an answer), and the subsequent layers perform an investigative routine that either confirms or challenges that initial state. The middle layers (~10-25 for 8B, ~30-60 for 70B) appear to be the critical "investigative engine" where this processing is most active.
DECODING INTELLIGENCE...