## Line Graph: I-Don't-Know Rate Across Llama-3 Models and Datasets
### Overview
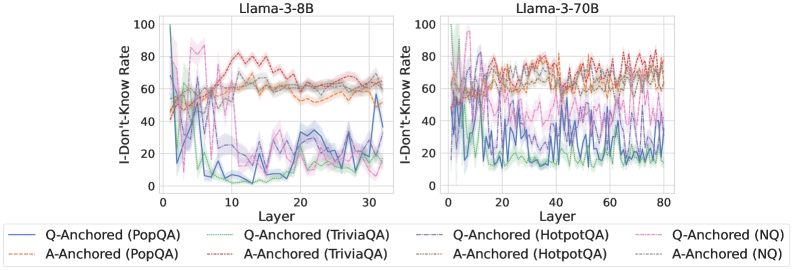
The image contains two line graphs comparing the "I-Don't-Know Rate" (percentage of unanswered questions) across layers of two Llama-3 language models: Llama-3-8B (left) and Llama-3-70B (right). Each graph shows six data series representing different question-answering datasets (PopQA, TriviaQA, HotpotQA, NQ) and anchoring methods (Q-Anchored vs. A-Anchored). The graphs reveal layer-specific performance variations and dataset-dependent trends.
### Components/Axes
- **X-axis (Layer)**:
- Llama-3-8B: 0–30 layers (discrete increments)
- Llama-3-70B: 0–80 layers (discrete increments)
- **Y-axis (I-Don't-Know Rate)**: 0–100% (continuous scale)
- **Legend**:
- **Q-Anchored (PopQA)**: Solid blue line
- **A-Anchored (PopQA)**: Dashed orange line
- **Q-Anchored (TriviaQA)**: Dotted green line
- **A-Anchored (TriviaQA)**: Dash-dot purple line
- **Q-Anchored (HotpotQA)**: Solid pink line
- **A-Anchored (HotpotQA)**: Dashed gray line
- **Q-Anchored (NQ)**: Dotted magenta line
- **A-Anchored (NQ)**: Dash-dot cyan line
### Detailed Analysis
#### Llama-3-8B (Left Graph)
- **Q-Anchored (PopQA)**: Starts at ~80% in Layer 0, sharply declines to ~20% by Layer 10, then fluctuates between 10–30%.
- **A-Anchored (PopQA)**: Begins at ~60%, stabilizes around 40–60% with minor oscillations.
- **Q-Anchored (TriviaQA)**: Peaks at ~70% in Layer 0, drops to ~30% by Layer 10, then stabilizes at 20–40%.
- **A-Anchored (TriviaQA)**: Remains relatively flat (~50–70%) with slight dips.
- **Q-Anchored (HotpotQA)**: Starts at ~90%, plunges to ~10% by Layer 10, then oscillates between 5–25%.
- **A-Anchored (HotpotQA)**: Starts at ~70%, declines to ~30% by Layer 10, then stabilizes at 20–40%.
- **Q-Anchored (NQ)**: Begins at ~50%, drops to ~10% by Layer 10, then fluctuates between 5–15%.
- **A-Anchored (NQ)**: Starts at ~30%, declines to ~10% by Layer 10, then stabilizes at 5–10%.
#### Llama-3-70B (Right Graph)
- **Q-Anchored (PopQA)**: Starts at ~70%, declines to ~30% by Layer 20, then fluctuates between 20–50%.
- **A-Anchored (PopQA)**: Begins at ~50%, stabilizes around 30–50% with minor oscillations.
- **Q-Anchored (TriviaQA)**: Peaks at ~80% in Layer 0, drops to ~40% by Layer 20, then stabilizes at 30–50%.
- **A-Anchored (TriviaQA)**: Remains flat (~60–80%) with slight dips.
- **Q-Anchored (HotpotQA)**: Starts at ~95%, plunges to ~20% by Layer 20, then oscillates between 10–30%.
- **A-Anchored (HotpotQA)**: Starts at ~60%, declines to ~20% by Layer 20, then stabilizes at 10–25%.
- **Q-Anchored (NQ)**: Begins at ~60%, drops to ~20% by Layer 20, then fluctuates between 10–25%.
- **A-Anchored (NQ)**: Starts at ~40%, declines to ~10% by Layer 20, then stabilizes at 5–10%.
### Key Observations
1. **Model Size Impact**: Llama-3-70B shows more pronounced fluctuations in I-Don't-Know rates compared to Llama-3-8B, especially in early layers.
2. **Anchoring Method**:
- Q-Anchored methods generally exhibit higher initial rates but sharper declines.
- A-Anchored methods maintain more stable, lower rates across layers.
3. **Dataset Sensitivity**:
- HotpotQA (complex reasoning) shows the highest initial rates and steepest declines.
- NQ (simple QA) demonstrates the most consistent performance improvements.
4. **Layer Dynamics**:
- Early layers (0–10) show rapid rate reductions for Q-Anchored methods.
- Later layers (10–30/80) exhibit stabilization or minor oscillations.
### Interpretation
The data suggests that anchoring methods significantly influence model performance:
- **Q-Anchored** approaches (question-focused) may initially struggle with complex datasets (e.g., HotpotQA) but improve rapidly as layers progress.
- **A-Anchored** methods (answer-focused) maintain steadier performance, possibly due to better generalization across layers.
- Larger models (70B) exhibit greater sensitivity to dataset complexity, with more volatile rates in early layers. This could indicate architectural differences in handling nuanced reasoning tasks.
- The NQ dataset’s consistent low rates across both models suggest it aligns well with the models’ training objectives, while HotpotQA highlights challenges in multi-hop reasoning.
The trends imply that anchoring strategy and model scale interact to shape performance, with practical implications for optimizing QA systems in resource-constrained scenarios.