## Line Graph: Model Performance Projections vs. Computational Resources
### Overview
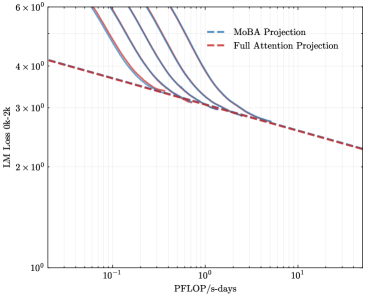
The image depicts a logarithmic-scale line graph comparing two computational efficiency projections: "MoBA Projection" (blue dashed line) and "Full Attention Projection" (red dashed line). The graph illustrates how model loss (LM Loss 0k-2k) decreases as computational resources (PFlOP/s-days) increase.
### Components/Axes
- **X-axis (Horizontal)**:
- Label: "PFlOP/s-days" (logarithmic scale)
- Markers: 10⁻¹, 10⁰, 10¹
- Range: 0.1 to 10 PFlOP/s-days
- **Y-axis (Vertical)**:
- Label: "LM Loss 0k-2k" (logarithmic scale)
- Markers: 10⁰, 2×10⁰, 3×10⁰, 4×10⁰, 5×10⁰, 6×10⁰
- Range: 1 to 6 (in logarithmic units)
- **Legend**:
- Position: Top-right corner
- Entries:
- Blue dashed line: "MoBA Projection"
- Red dashed line: "Full Attention Projection"
### Detailed Analysis
1. **MoBA Projection (Blue Dashed Line)**:
- Starts at ~5×10⁰ loss at 10⁻¹ PFlOP/s-days.
- Declines sharply to ~3×10⁰ at 10⁰ PFlOP/s-days.
- Continues to decrease gradually, reaching ~2.5×10⁰ at 10¹ PFlOP/s-days.
- Slope: Steeper initial decline, then flattens slightly.
2. **Full Attention Projection (Red Dashed Line)**:
- Starts at ~4×10⁰ loss at 10⁻¹ PFlOP/s-days.
- Declines linearly to ~3×10⁰ at 10⁰ PFlOP/s-days.
- Maintains a consistent slope, reaching ~2.2×10⁰ at 10¹ PFlOP/s-days.
- Slope: Linear decline throughout the range.
3. **Intersection Point**:
- Both lines converge near 10⁰ PFlOP/s-days (~3×10⁰ loss).
- After this point, MoBA Projection outperforms Full Attention Projection.
### Key Observations
- **Convergence**: Both models achieve similar loss reduction (~3×10⁰) at 10⁰ PFlOP/s-days.
- **Divergence**: MoBA Projection becomes more efficient than Full Attention Projection at higher resource levels (10¹ PFlOP/s-days).
- **Efficiency Trends**:
- MoBA Projection shows diminishing returns at higher PFlOP/s-days.
- Full Attention Projection maintains linear scalability.
### Interpretation
The graph suggests that MoBA Projection is more resource-efficient at higher computational scales (10¹ PFlOP/s-days), while Full Attention Projection performs better at lower resource levels (10⁻¹ to 10⁰ PFlOP/s-days). The convergence at 10⁰ PFlOP/s-days indicates a critical threshold where MoBA's architectural advantages (e.g., optimized attention mechanisms) begin to outweigh Full Attention's simpler design. This implies that MoBA may be preferable for large-scale deployments, whereas Full Attention could be more cost-effective for smaller-scale applications. The logarithmic axes highlight exponential relationships between resource allocation and performance gains, emphasizing the importance of scaling strategies in model optimization.