## Chart: LM Loss vs. PFLOP/s-days
### Overview
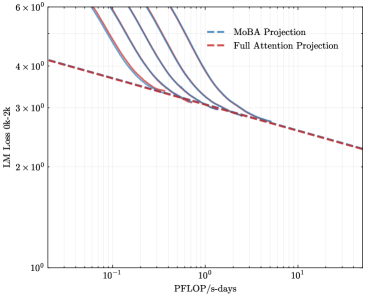
The image is a line chart comparing the Language Model (LM) Loss of "MoBA Projection" and "Full Attention Projection" models against the computational cost measured in PFLOP/s-days. The y-axis represents LM Loss (0k-2k), and the x-axis represents PFLOP/s-days. The chart shows how the loss decreases as the computational cost increases for both models.
### Components/Axes
* **X-axis:** PFLOP/s-days (ranges from approximately 0.1 to 10)
* **Y-axis:** LM Loss 0k-2k (ranges from 1 x 10^0 to 6 x 10^0)
* **Legend:** Located in the top-right corner.
* MoBA Projection (blue lines)
* Full Attention Projection (red dashed line)
### Detailed Analysis
* **Full Attention Projection (Red Dashed Line):**
* Trend: The loss decreases steadily as PFLOP/s-days increases.
* Data Points:
* At 0.1 PFLOP/s-days, LM Loss is approximately 4.1 x 10^0.
* At 1 PFLOP/s-days, LM Loss is approximately 2.8 x 10^0.
* At 10 PFLOP/s-days, LM Loss is approximately 2.2 x 10^0.
* **MoBA Projection (Blue Lines):** There are multiple blue lines, each representing a different configuration or parameter setting for the MoBA Projection model.
* Trend: All blue lines show a decreasing loss as PFLOP/s-days increases, but the decrease is more rapid initially and then plateaus.
* Data Points (Approximate, for the lowest MoBA line):
* At 0.1 PFLOP/s-days, LM Loss is approximately 4.8 x 10^0.
* At 1 PFLOP/s-days, LM Loss is approximately 3.1 x 10^0.
* At 10 PFLOP/s-days, LM Loss is approximately 2.7 x 10^0.
### Key Observations
* The Full Attention Projection model starts with a lower loss at low PFLOP/s-days compared to the MoBA Projection models.
* The MoBA Projection models show a steeper initial decrease in loss as PFLOP/s-days increases.
* At higher PFLOP/s-days, the LM Loss for the MoBA Projection models approaches that of the Full Attention Projection model.
### Interpretation
The chart compares the performance of two language model projection techniques: MoBA and Full Attention. The data suggests that while Full Attention Projection initially has a lower loss, MoBA Projection can achieve comparable or even better performance with increased computational resources (PFLOP/s-days). The multiple MoBA lines likely represent different configurations or parameter settings, indicating that the performance of MoBA Projection is sensitive to these factors. The rapid initial decrease in loss for MoBA Projection suggests diminishing returns as computational resources increase. The point where the MoBA lines converge with the Full Attention line indicates a potential threshold where the two methods achieve similar performance levels.