## Stacked Bar Chart: Self-Rewarding vs. SFT Baseline Wins
### Overview
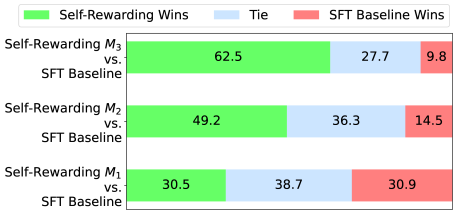
The image is a stacked horizontal bar chart comparing the performance of three self-rewarding models (M1, M2, and M3) against an SFT (Supervised Fine-Tuning) Baseline. The chart displays the percentage of wins for the self-rewarding models, ties, and wins for the SFT Baseline.
### Components/Axes
* **Y-axis (Implicit):** Represents the different model comparisons:
* Self-Rewarding M3 vs. SFT Baseline
* Self-Rewarding M2 vs. SFT Baseline
* Self-Rewarding M1 vs. SFT Baseline
* **X-axis (Implicit):** Represents the percentage of outcomes (wins, ties).
* **Legend (Top):**
* Green: Self-Rewarding Wins
* Light Blue: Tie
* Light Red: SFT Baseline Wins
### Detailed Analysis
The chart presents three horizontal bars, each representing a comparison between a self-rewarding model and the SFT Baseline. Each bar is segmented into three colored sections, corresponding to the percentage of wins for the self-rewarding model (green), ties (light blue), and wins for the SFT Baseline (light red).
* **Self-Rewarding M3 vs. SFT Baseline:**
* Self-Rewarding Wins: 62.5% (Green)
* Tie: 27.7% (Light Blue)
* SFT Baseline Wins: 9.8% (Light Red)
* **Self-Rewarding M2 vs. SFT Baseline:**
* Self-Rewarding Wins: 49.2% (Green)
* Tie: 36.3% (Light Blue)
* SFT Baseline Wins: 14.5% (Light Red)
* **Self-Rewarding M1 vs. SFT Baseline:**
* Self-Rewarding Wins: 30.5% (Green)
* Tie: 38.7% (Light Blue)
* SFT Baseline Wins: 30.9% (Light Red)
### Key Observations
* Self-Rewarding M3 has the highest percentage of wins compared to the SFT Baseline (62.5%).
* Self-Rewarding M1 has the lowest percentage of wins compared to the SFT Baseline (30.5%) and the highest percentage of SFT Baseline wins (30.9%).
* The percentage of ties is highest for Self-Rewarding M1 (38.7%) and lowest for Self-Rewarding M3 (27.7%).
### Interpretation
The data suggests that Self-Rewarding M3 performs the best against the SFT Baseline, with a significantly higher win rate. Self-Rewarding M2 also outperforms the SFT Baseline, but to a lesser extent than M3. Self-Rewarding M1 shows a more balanced performance, with a lower win rate and a higher percentage of wins for the SFT Baseline, indicating that it is the least effective of the three self-rewarding models when compared to the SFT Baseline. The tie percentages vary across the models, suggesting differences in the consistency or competitiveness of the outcomes.